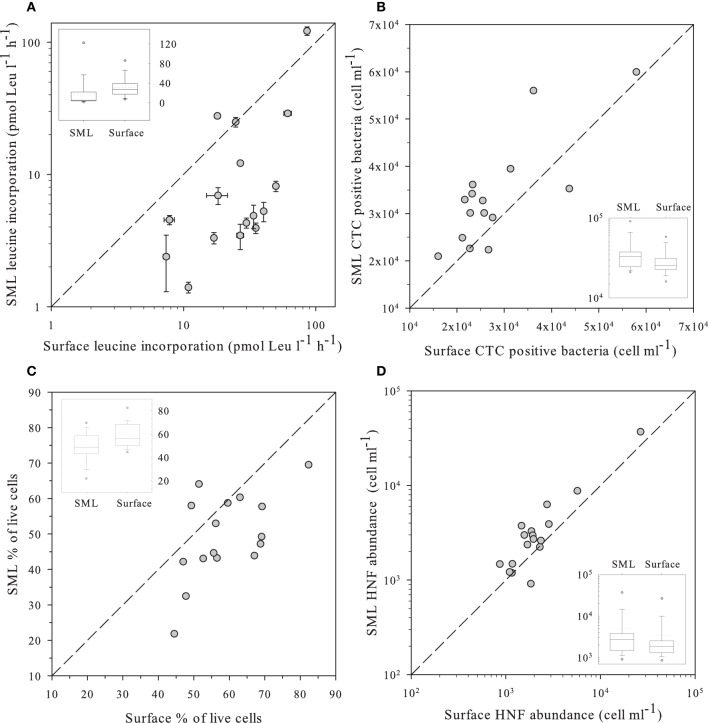
Figure 2.
(A) Leucine incorporation in SML samples vs. values observed in the surface; (B) Number of heterotrophic prokaryote cells with high respiration rates (CTC+) in SML samples vs. those observed in the surface as determined by flow cytometry and the CTC staining protocol. (C) Percentage of “live” cells in the SML samples vs. the value observed at the surface as determined by flow cytometry and the NADS staining protocol. (D) Abundance of HNF in SML samples vs. values observed in the surface measured by flow cytometry with the Lysotracker staining protocol. In all panels, the dashed line indicates the 1:1 ratio. Insets in each panel indicate the distribution of values for surface and the SML. The central line indicates the median value, boxes indicate the lower and upper quartiles, and vertical lines indicate the 10th and 90th percentiles.

