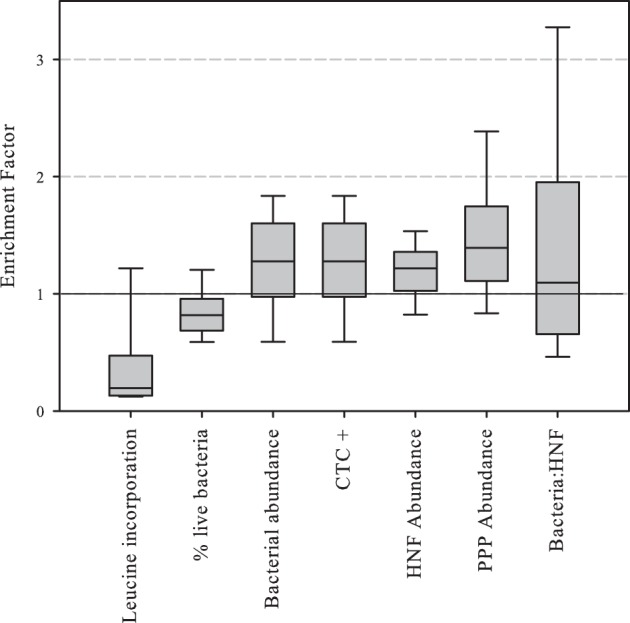
Figure 3.

Boxplot of abundance or activity enrichment factors in the piconeuston (i.e., SML:surface). Central line indicates median value, boxes the lower and upper quartiles, and vertical lines indicate 10th and 90th percentiles.

Boxplot of abundance or activity enrichment factors in the piconeuston (i.e., SML:surface). Central line indicates median value, boxes the lower and upper quartiles, and vertical lines indicate 10th and 90th percentiles.