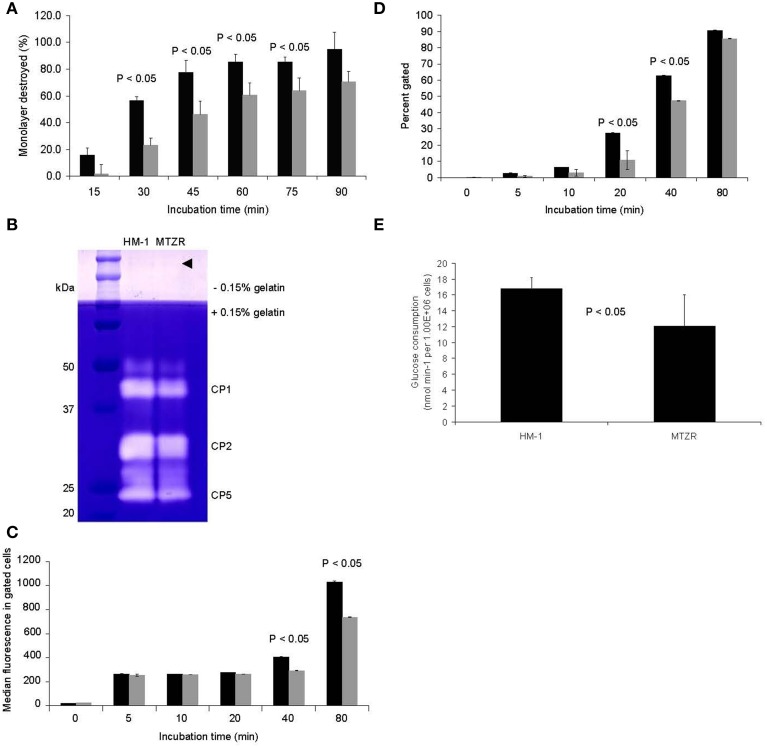
Figure 2.
Phenotypic changes observed in MTZR. Statistical significance is indicated (P-value < 0.05). (A) CHO monolayer destruction assay of HM-1 (black bars) and MTZR (gray bars). (B) Zymography of whole cell lysates of HM-1 and MTZR. An arrowhead indicates comparable protein loading per lane as estimated by CBB staining of irrelevant proteins. (C,D) Phagocytosis assay with carboxylated beads in HM-1 (black bars) and MTZR (gray bars). The number of beads phagocytosed (C) and the percentage of cells with engulfed beads (D) at indicated time points are compared between HM-1 and MTZR. (E) Glucose consumption assay.

