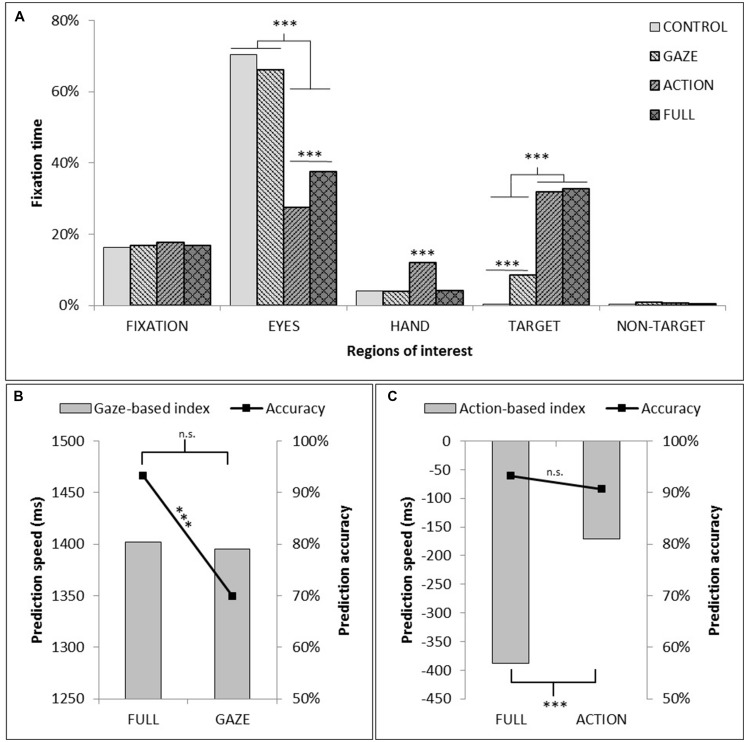
FIGURE 3.
(A) Proportion of total fixation time within each of the five ROIs as a function of observation conditions (In the CONTROL condition, as no specific object could be reported as ‘TARGET’ or ‘NON-TARGET,’ the average fixation time on both objects was plotted). (B) Measure of the contribution of action information to prediction speed and prediction accuracy through the comparison of GAZE and FULL conditions. (C) Measure of the contribution of gaze information to prediction speed and prediction accuracy through the comparison of ACTION and FULL conditions. The asterisks indicate a significant difference between experimental conditions (∗p < 0.05; ∗∗p < 0.01; ∗∗∗p < 0.005).

