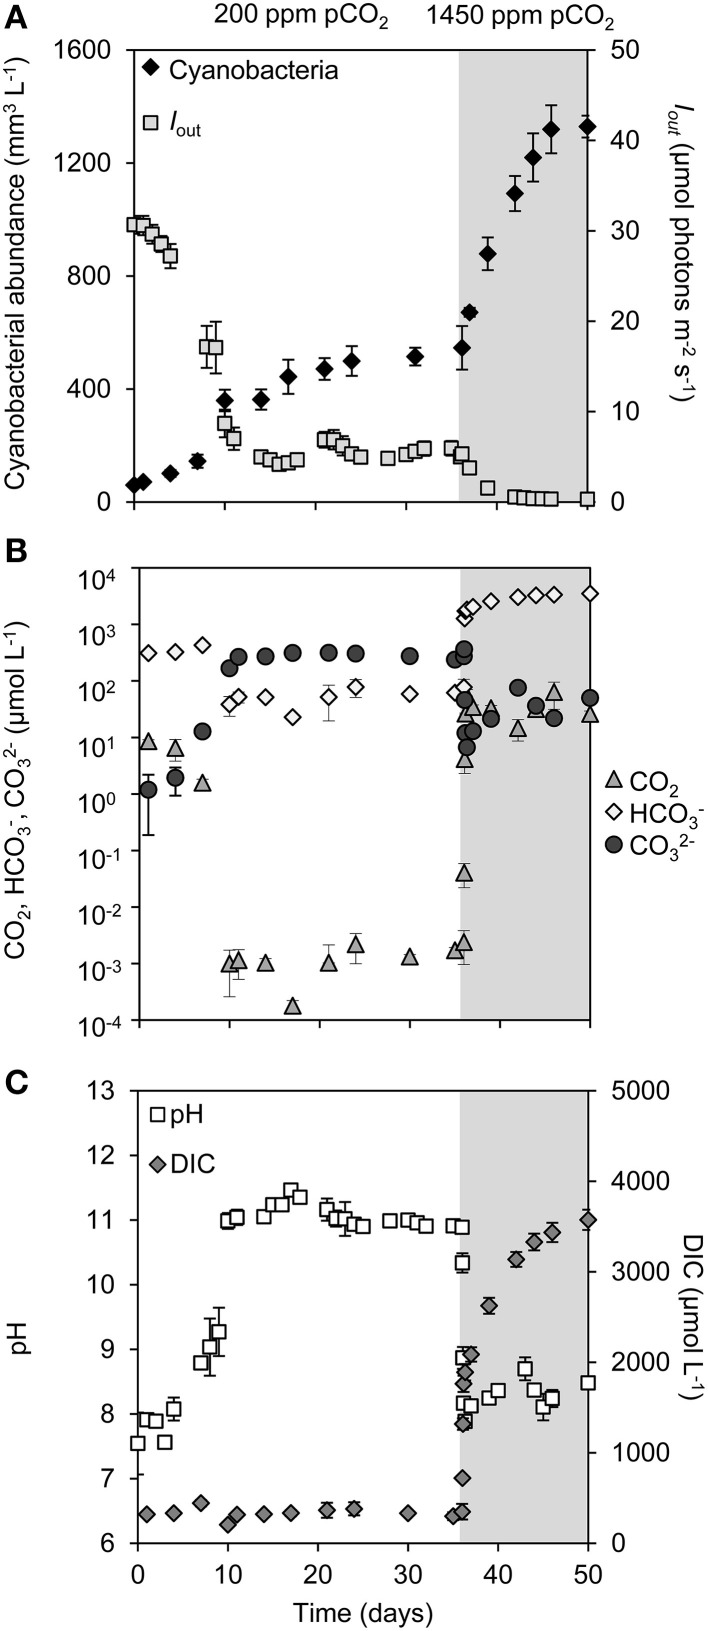
Figure 1.
Changes in cyanobacterial abundance, light, dissolved inorganic carbon (DIC) and pH during a shift from low pCO2 (200 ppm, white area) to high pCO2 (1450 ppm, shaded area). (A) Cyanobacterial abundance (expressed as biovolume) and light intensity penetrating through the chemostat (Iout). (B) Dissolved CO2 (dCO2), bicarbonate (HCO−3) and carbonate (CO2−3) concentrations (logarithmic scale). (C) Dissolved inorganic carbon (DIC) and pH. Error bars indicate standard deviations (n = 4).

