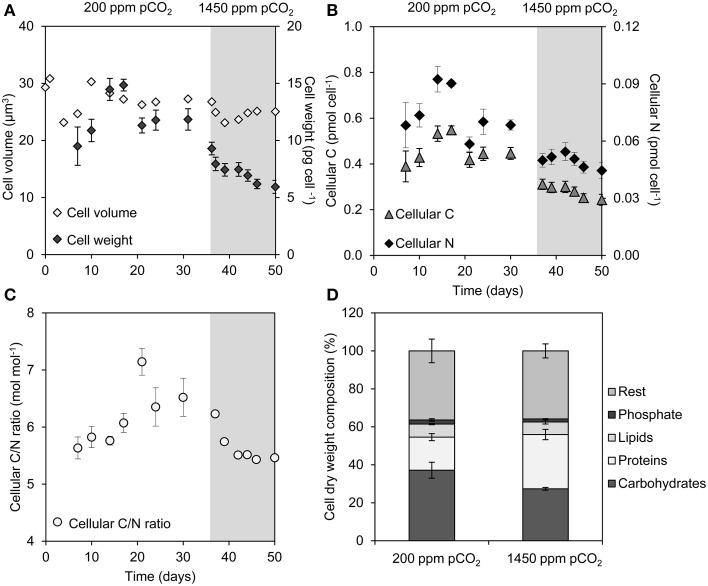
Figure 2.
Changes in cell properties during a shift from low pCO2 (200 ppm, white area) to high pCO2 (1450 ppm, shaded area). (A) Average cell volume and cell weight. (B) Cellular elemental C and N content. (C) Molar C/N ratio of the cells. (D) Dry weight composition of cells from the steady states at 200 and 1450 ppm pCO2. Error bars indicate standard deviations (n = 4).

