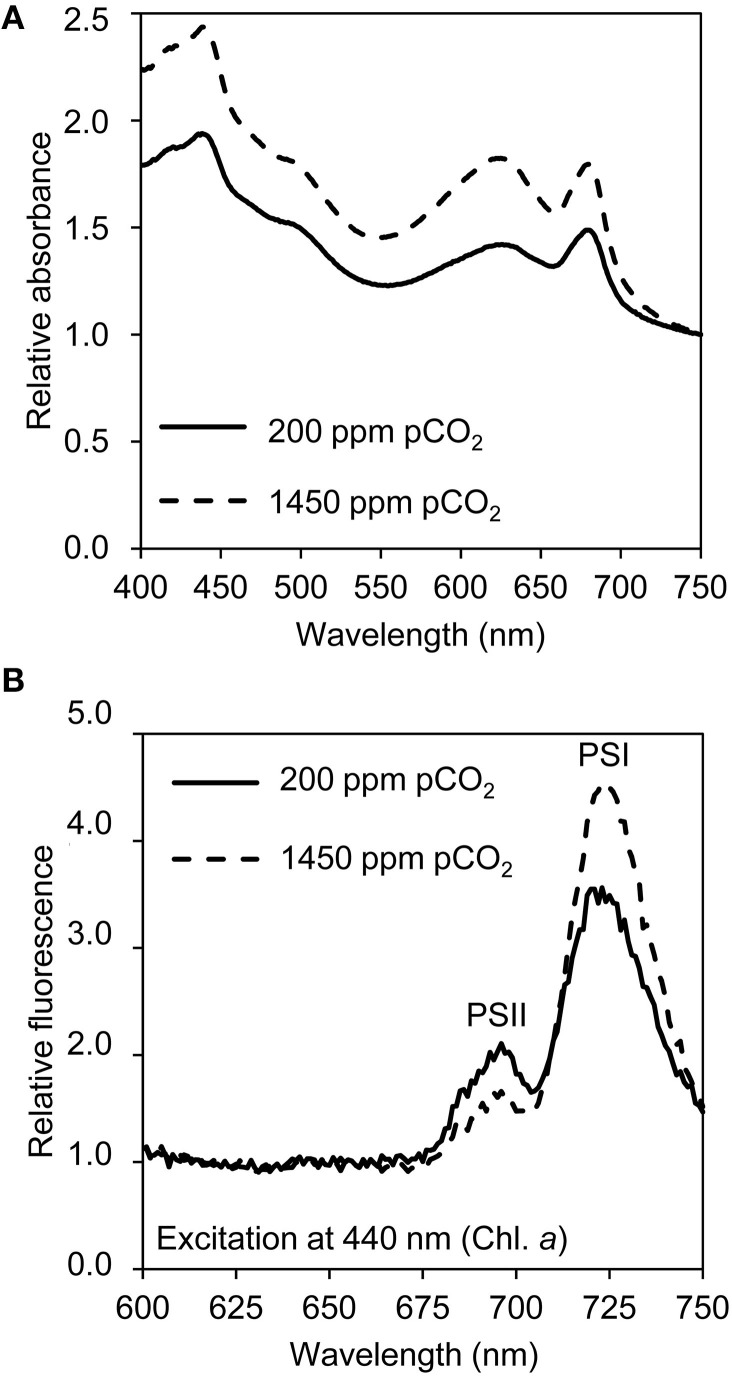
Figure 3.
Light absorption and emission spectra of cells grown at low pCO2 (200 ppm) and high pCO2 (1450 ppm). (A) Light absorption spectra normalized at 750 nm, with peaks of chlorophyll a (436 and 678 nm), β-carotene (shoulder at 490 nm) and phycocyanin (626 nm). (B) 77 K fluorescence emission spectra normalized based on the mean emission at 600–660 nm, with peaks of PSI (720 nm) and PSII (695 nm). The spectra are the average of four biological replicates.

