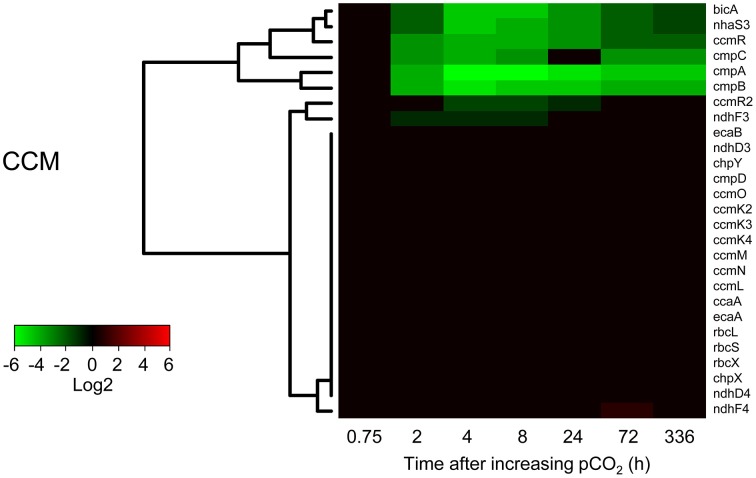
Figure 5.
Changes in expression of the CO2-concentrating mechanism (CCM) genes after the increase of pCO2 to 1450 ppm. Expression changes are quantified as log2 values. Red indicates significant upregulation and green significant downregulation; non-significant changes are in black. Hierarchical clustering was used to order the genes. The underlying data are presented in Supplementary Table 4.

