Fig. 2.
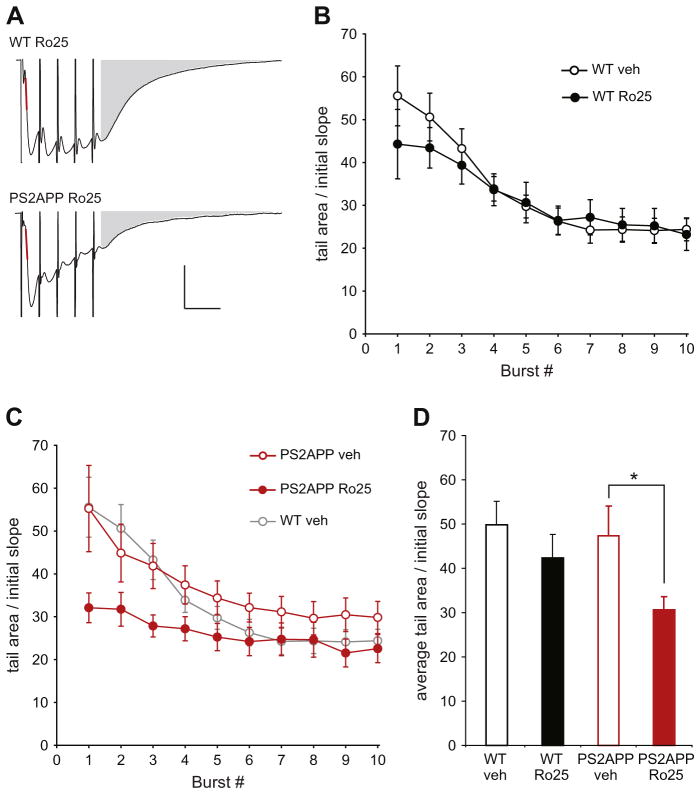
Ro25 treatment reduces EPSP tail area during LTP induction in PS2APP mice. (A) Sample average TBS-induced composite EPSPs (AMPAR+NMDAR) during LTP induction are shown for Ro25 treated slices from wt and PS2APP mice. The red line indicates the initial slope and the gray area indicates tail area that was used for quantification. Scale bars are 1 mV and 20 ms. (B) The area of the average EPSP tail during TBS for vehicle and Ro25 treated wt slices is shown (n = 5 veh, 5 Ro25). Data are normalized to the initial slope of each recording. (C) The area of the average EPSP tail during TBS for vehicle and Ro25 treated PS2APP slices is shown (n = 7 veh, 8 Ro25), wt vehicle data from panel A are re-plotted in gray for comparison. (D) Quantification of the average tail area normalized to the initial slope is shown for the first 3 bursts (prior to significant rundown of the burst responses on the later bursts). Assessment by ANOVA revealed an effect of treatment (p < 0.05) and post hoc tests showed a significant effect of treatment within PS2APP mice (p < 0.05). All data are shown as mean ± SEM.

