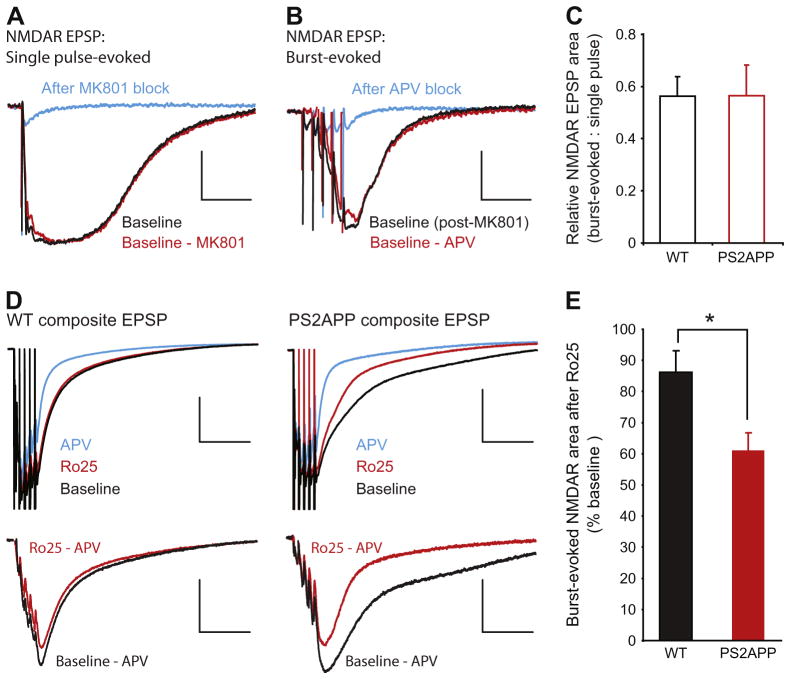
Fig. 4.
NMDARs activated during bursts of stimuli are excessively sensitive to Ro25 in PS2APP mice. (A) After obtaining stable isolated NMDAR EPSP responses to single stimuli (black trace), MK-801 was applied to the slice and single pulse stimulation was continued to block the synaptic NMDAR response. Following 300 stimuli in the presence of MK-801 there was only a small residual component of the response remaining (blue). The single pulse evoked NMDAR EPSP area was quantified by subtracting this residual component from the baseline response (red). Scale bars are 1 mV and 50 ms. (B) After blocking the single pulse evoked NMDAR response, MK-801 was washed from the slice for 35 min. At this time point a single stimulus still failed to evoke an EPSP indicating no recovery of synaptic NMDARs (not shown). However, when synapses were activated with bursts of 5 stimuli at 100 Hz a substantial NMDAR EPSP was evoked (black). This burst-evoked response could be blocked by AP5 application (blue). The burst evoked NMDAR EPSP area was quantified by subtracting the residual component in the presence of AP5 from the initial burst response (red). Scale bars are 1 mV and 50 ms. (C) The ratio of single pulse-evoked to burst-evoked NMDAR EPSP area was not significantly different between wt and PS2APP mice (n = 12 wt, 9 PS2APP). (D) To avoid rundown during burst responses, composite EPSPs (AMPAR + NMDAR) were recorded under physiological conditions in response to burst stimulation. Top: After a stable baseline was acquired (black), Ro25 was applied to the slice for 40 min and the remaining response was measured (red). Subsequently AP5 was added to block the NMDAR component of the composite EPSP, leaving only the AMPAR component (blue). Scale bars for composite traces are 1 mV and 100 ms. Bottom: The NMDAR component during the baseline period (black) and after Ro25 application (red) was determined by subtracting the EPSP recorded in the presence of AP5. Sample subtracted traces from wt and PS2APP mice are shown with stimulus artifacts removed. Scale bars for subtracted traces are 0.5 mV and 100 ms. (E) While Ro25 caused only a small reduction in the burst-evoked NMDAR EPSP in wt mice, there was a significantly greater reduction in PS2APP mice (p < 0.05, n = 10 wt, 12 PS2APP). All data are shown as mean ± SEM.

