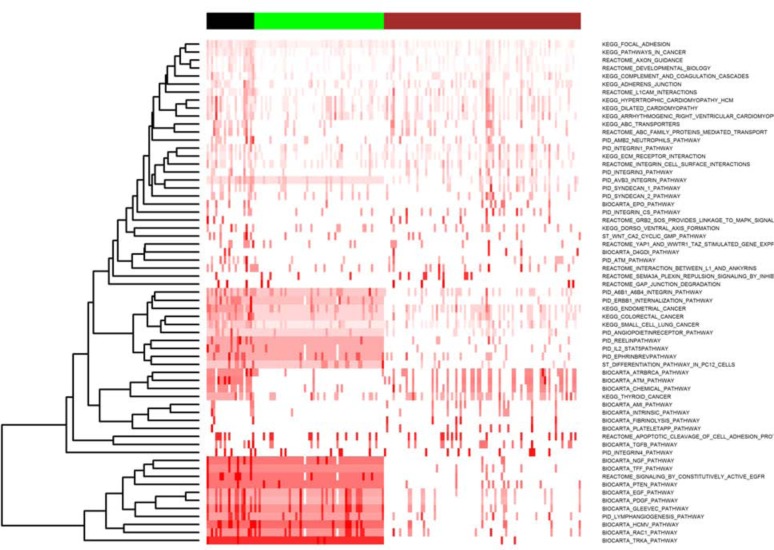
Figure 1.
This ordered heatmap shows pathway-level clustering of 173 patients treated with AI across 63 pathways-enriched MS-AE relevant variants. The color of heatmap from white to red indicates low to high percentages (0% to 100%) of genes affected by MS-AE relevant variants. Column color-bar on top of the heatmap indicates three clusters of samples: Cluster 1 (brown), Cluster 2 (green) and Cluster 3 (black). Note that the number of the patients (n=173) with pathway enrichment is less than total number of the identified cohort (n=212) is because not all patients have prioritized variants listed.

