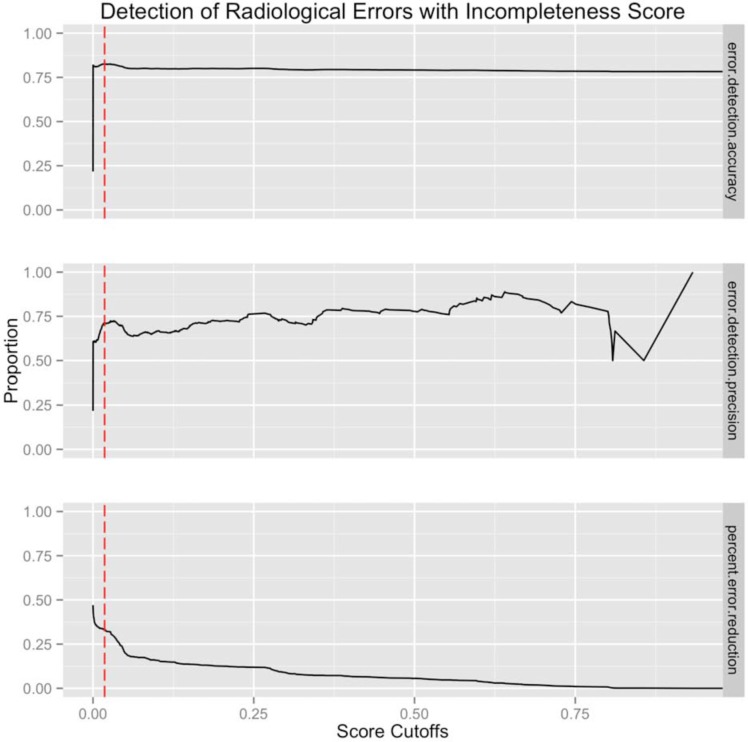
Figure 2:
Improvement in radiological performance for difference incompleteness cutoffs. First row shows the incompleteness score accuracy in predicting radiological errors. Second row shows incompleteness score positive predictive value in predicting error. Third row shows the percent reduction in error if identifying error at the specified cutoff. The red-dotted line shows the cutoff point that maximizes error classification accuracy (first panel).

