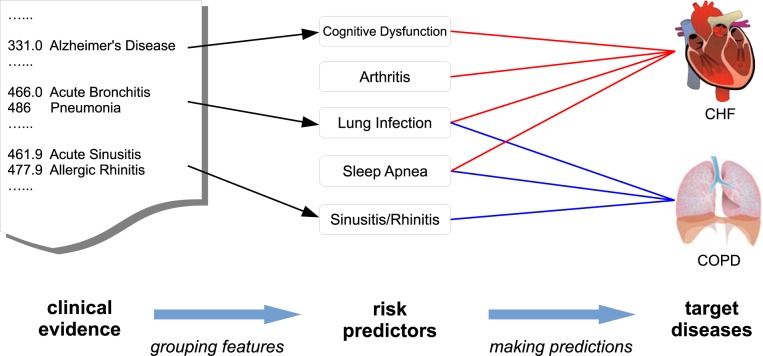
Figure 1:
An intuitive example to demonstrate the problem setting for multi-task risk prediction. The lines between target diseases and risk predictors indicate strong connection. The arrows show the mapping from the raw clinical evidence (diagnosis code in this case) to the high-level risk predictors. We want to learn both the lines and the arrows.

