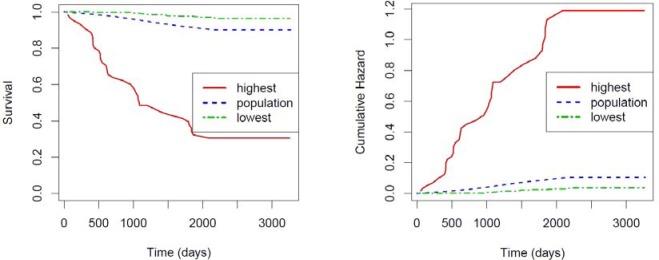
Figure 1.

Kaplan-Meier survival curve (Left) and Cumulative incidence of diabetes (Right) for two pre-diabetic subpopulations (red sold and green dotdash) and the entire population (blue dotted)

Kaplan-Meier survival curve (Left) and Cumulative incidence of diabetes (Right) for two pre-diabetic subpopulations (red sold and green dotdash) and the entire population (blue dotted)