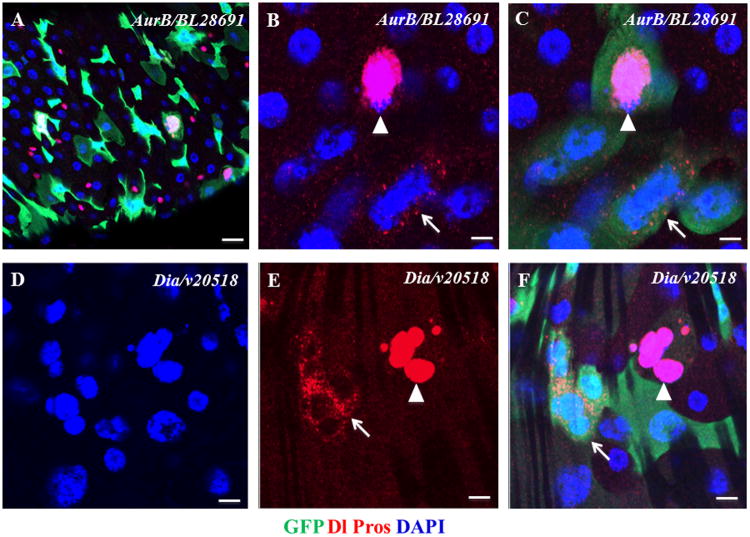
Figure 4. The Larger Nuclei of Knockdowns of AurB and Dia.
(A–C) Knockdown of AurB resulted in larger nuclei of ISCs (arrow in B and C) and EE cells (arrowhead in B and C).
(D–F) Knockdown of Dia resulted in larger nuclei of the ISC cluster (arrow in E and F) and the EE cell cluster (arrowhead in E and F).
The posterior midguts of corresponding flies were dissected, stained with antibodies of GFP+Dl+Pros+DAPI, and analyzed by confocal microscopy. Scale bars: 10 μm in A, 2.5 μm in B and C, 5 μm in D–F.
See also Table S1C.

