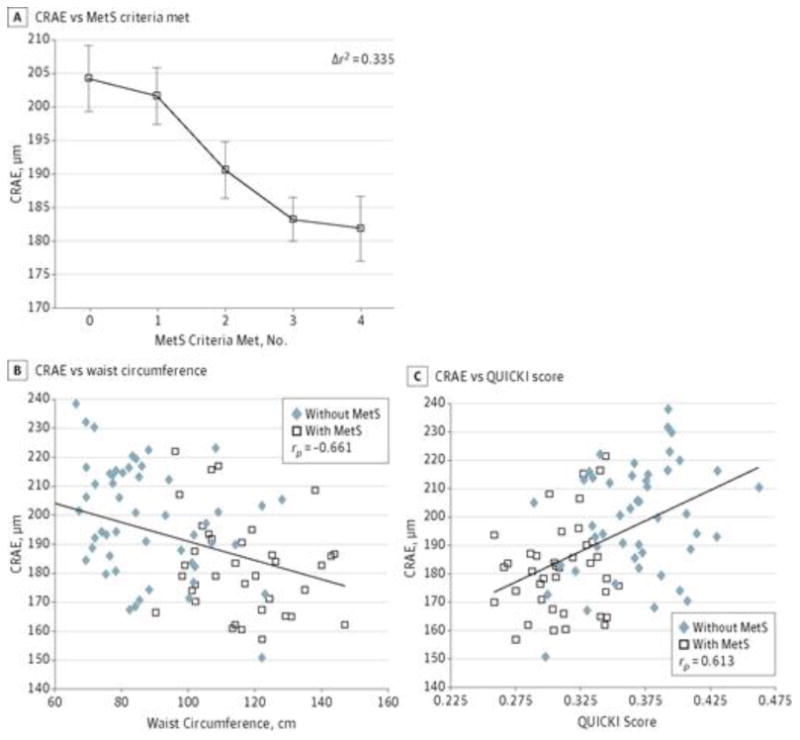
Figure 1. Relationships Between Central Retinal Arteriolar Equivalent (CRAE) and Metabolic Syndrome (MetS) Components.

A, Smaller retinal diameter with increasing number of MetS components present for individuals who met 0 criteria (n = 16), 1 criterion (n = 17), 2 criteria (n = 18), 3 criteria (n = 25), or 4 criteria (n = 12). Data presented are raw retinal arteriolar diameters (CRAE values) expressed as mean (SEM [error bars]), but the statistics were done controlling for age, central retinal venular equivalent, and systolic blood pressure. B, Smaller CRAE is associated with larger waist circumference after accounting for age and central retinal venular equivalent. C, Smaller CRAE is associated with more insulin resistance (lower quantitative insulin sensitivity check index [QUICKI] score) after accounting for age and central retinal venular equivalent. B and C, The CRAE values presented are raw values; the analysis was performed controlling for age and central retinal venular equivalent.
Imaging Results: There were no clinically relevant WM hyperintensities on any of the fluid-attenuated inversion recovery images. The voxelwise analysis of covariance revealed a total of 11 clusters (2654 voxels or 2.654 cm3 in volume; P < .0005; the 6 largest clusters are displayed in order of size in Figure 2), all showing significant reductions in WM FA in adolescents with MetS. The clusters were located in major WM fibers including the optic radiation (right hemisphere, 565 voxels), left internal capsule (left hemisphere, 385 voxels), extreme capsule (left hemisphere, 359 voxels), superior cerebellar peduncle (left hemisphere, 314 voxels; right hemisphere, 161 voxels), corpus callosum (body, 286 voxels), cerebral peduncle (left hemisphere, 138 voxels; right hemisphere, 107 voxels), middle cerebellar peduncle (left hemisphere, 102 voxels; right hemisphere, 129 voxels), and corona radiata (left hemisphere, 108 voxels). The largest 4 clusters remained significant at the next more conservative P value threshold of .0001, and at this extremely conservative statistical threshold, they still totaled 579 voxels (Figure 2). Given the known association between depression and cerebral WM, we repeated the analysis adding the BDI score as a covariate and confirmed that the FA differences remained largely unchanged.
