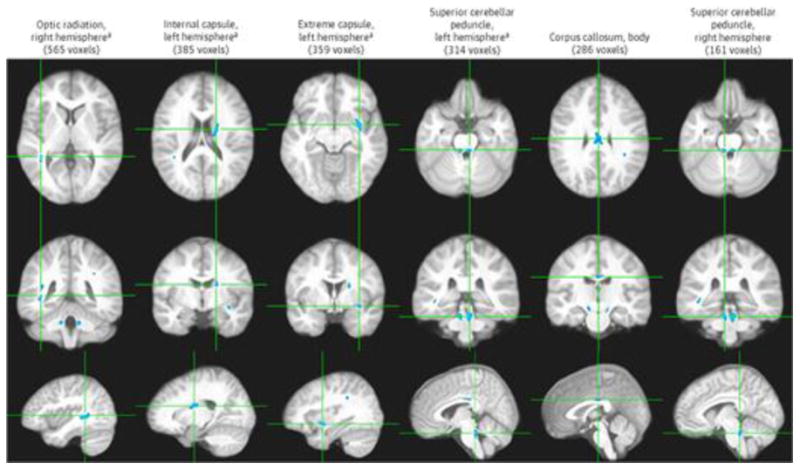
Figure 2. Six Largest Clusters of Significant Cerebral White Matter Fractional Anisotropy Reduction.

Six largest clusters of significant cerebral white matter fractional anisotropy reduction (P < .0005). Each column shows 3 orthogonal orientations of the average normalized structural image illustrating a significant cluster (blue; minimum cluster size of 100 contiguous voxels) with the axes passing through the centroid of the cluster.
aSignificant at P < .0001.
When we performed the voxelwise correlation analyses between WM FA and CRAE, we identified a total of 13 clusters (3150 voxels or 3.150 cm3; P < .001; the 6 largest clusters are displayed in Figure 3) of significant correlation independent of age and CRVE. All but 1 of these clusters showed positive correlation. The significant clusters were found in the optic radiation (left hemisphere, 439 voxels, rp2 = 0.149), middle cerebellar peduncle (right hemisphere, 422 voxels, rp2 = 0.157), corona radiata (left hemisphere, 354 voxels,rp2 = 0.143), corpus callosum (splenium, 301 voxels, rp2 = 0.131; genu, 279 voxels, rp2 = 0.139; body, 194 voxels, rp2 = 0.144), cerebral peduncle (left hemisphere, 283 voxels, rp2 = 0.147; right hemisphere, 277 voxels, rp2 = 0.147), superior cerebellar peduncle (left hemisphere, 143 voxels, rp2 = 0.135), extreme capsule (left hemisphere, 134 voxels, rp2 = 0.144), internal capsule (left hemisphere, 102 voxels, rp2 = 0.138), and cingulum (left hemisphere, 101 voxels, rp2 = 0.142). The single cluster that showed negative correlation was in the superior longitudinal fasciculus and was among the smallest (121 voxels, rp2 = 0.136). Of these 13 clusters, the 7 largest clusters, all showing positive association between CRAE and FA, remained significant at the next more conservative P value threshold of .0005; at this very conservative threshold, they still totaled 1458 voxels (Figure 3).
