
Figure 6.
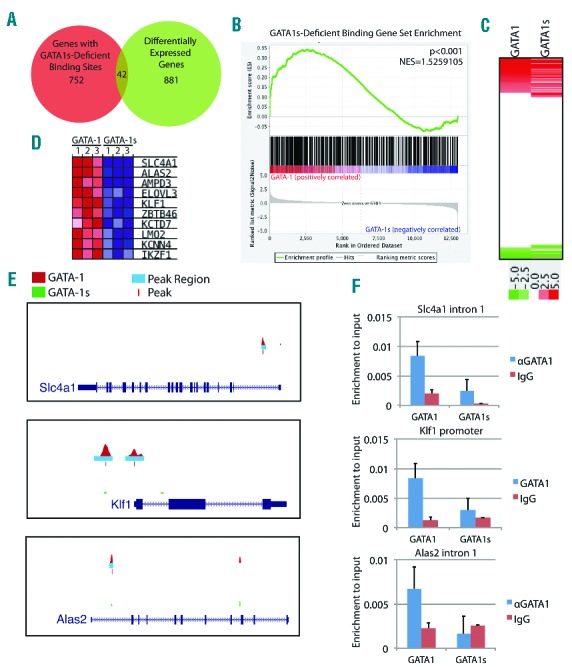
GATA1s is deficient for occupancy and activation of several erythroid-specific genes. (A) Venn diagram of the overlap of genes at GATA1s-deficient binding sites and genes differentially expressed by GATA1s relative to GATA1. (B) GSEA for the set of genes at GATA1s deficient binding sites on the gene expression data from GATA1 and GATA1s-expressing cells. (C) A heatmap depicting the expression of genes bound by both GATA1 and GATA1s. (D) The top 10 most significantly enriched genes from the GSEA analysis in (B) are depicted in a heatmap. (E) UCSC genome browser depictions of ChIP Seq data at GATA1s-deficient binding sites. GATA1 and GATA1s wig profiles are displayed in red and green, respectively. The light blue bars indicate enriched regions and the red dashes indicate the peak centers. (F) ChIP-qPCR for GATA1 and GATA1s in G1ME cells using anti-GATA1 antibody. Bar graphs represent average±SD of two independent experiments.