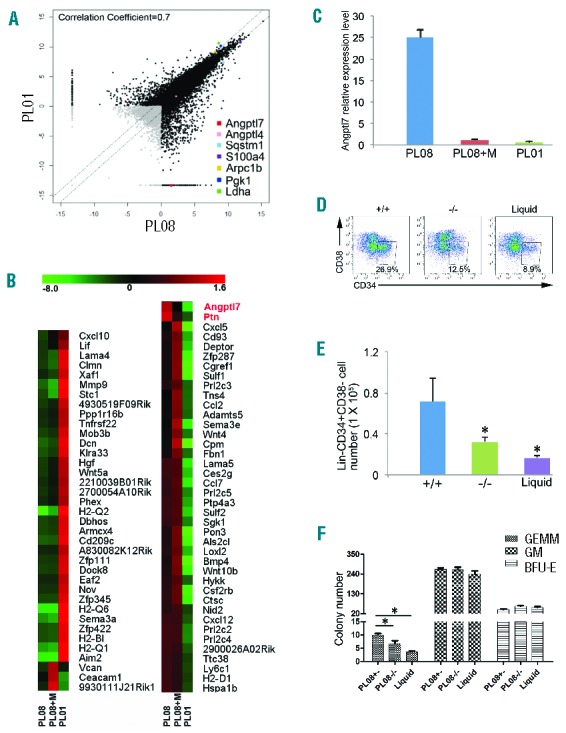
Figure 2.

Angptl7 is specifically expressed in the PL08 cell line. (A) Pairwise comparison of poly(A)+ RNA-Seq analysis of the global expression profiles in PL08 versus PL01 cells. Pearson correlation coefficient is shown. (B) Unsupervised hierarchical cluster analysis of expression levels of 77 secreted protein genes in PL08, PL08+M, and PL01 cells (red: increased expression; green: decreased expression). (C) qRT-PCR analysis of Angptl7 mRNA levels in PL08, PL08+M, and PL01 cells. The results were normalized to the β-actin mRNA levels and represent mean+s.e.m. (n=3). (D) A total of 2×10⁵ human umbilical cord blood nucleated cells (hUCBNCs) were isolated and co-cultured with PL08 cells, Angptl7-null PL08 cells in STPF conditions. In culture, hUCBNCs were separated from stromal cells using Transwell membranes. In another control group (Liquid), 2×10⁵ hUCBNCs were isolated and cultured without any stromal cells in StemSpan medium supplemented with STPF. Representative FACS plots show the percentages of Lin-CD34+CD38− cells in PL08, Angptl7-null PL08, and liquid culture conditions. (E) Summary of absolute numbers of Lin-CD34+CD38− cells in liquid culture condition (Liquid), or in co-culture with WT PL08 (+/−), or Angptl7−/− PL08 (−/−) cells at day 12 from four independent experiments (n=4). Data represent mean+s.e.m. *P≤0.05 versus bar 2 and bar 3 (for bar 1). (F) The colony numbers of CFU assays obtained cultured hUCBNCs as described in (D). Data represent mean+s.e.m. (n=4). *P≤0.05 versus bar 2 and bar 3 (for bar 1).
