
Figure 1.
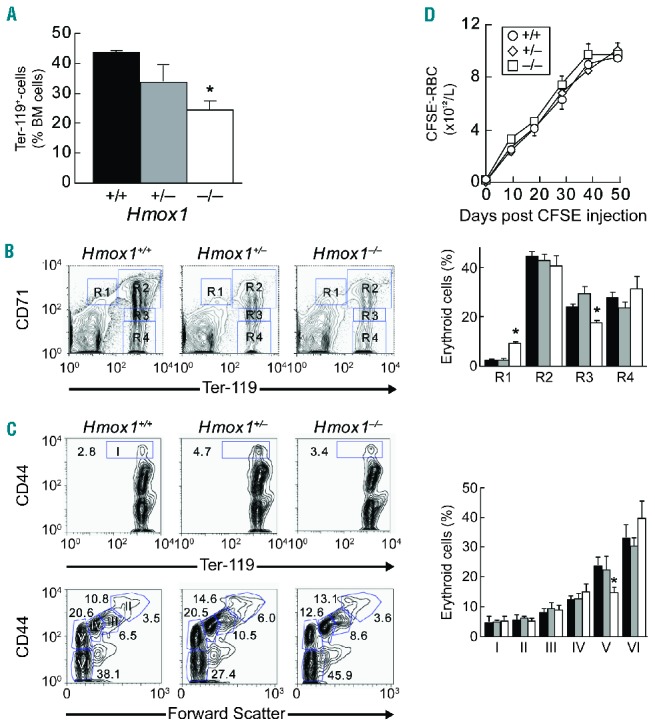
Altered steady-state erythropoiesis in the BM of Hmox1−/− mice. Erythroid maturation in BM of Hmox1+/+ (n=6), Hmox1+/− (n=3) and Hmox1−/− mice (n=5) was assessed by flow cytometry. (A) Proportion of nucleated and enucleated Ter-119+ BM cells. (B) Representative flow cytometric profiles and quantification of maturing erythroid populations R1-R4 as assessed by Ter-119 and CD71 surface expression. Results show the different populations as a percent of total cells. (C) Representative flow cytometric profiles and quantification of stages of erythroid differentiation as assessed by Ter-119 and CD44 expression in combination with forward scatter.31 (D) Graphic representation of the number of CFSEnegative-RBC over 48 days in Hmox1+/+ (circles), Hmox1+/− (diamonds) and Hmox1−/− mice (squares) (n=3 each). *P<0.05 compared with Hmox1+/+ and Hmox1+/−.