
Figure 1.
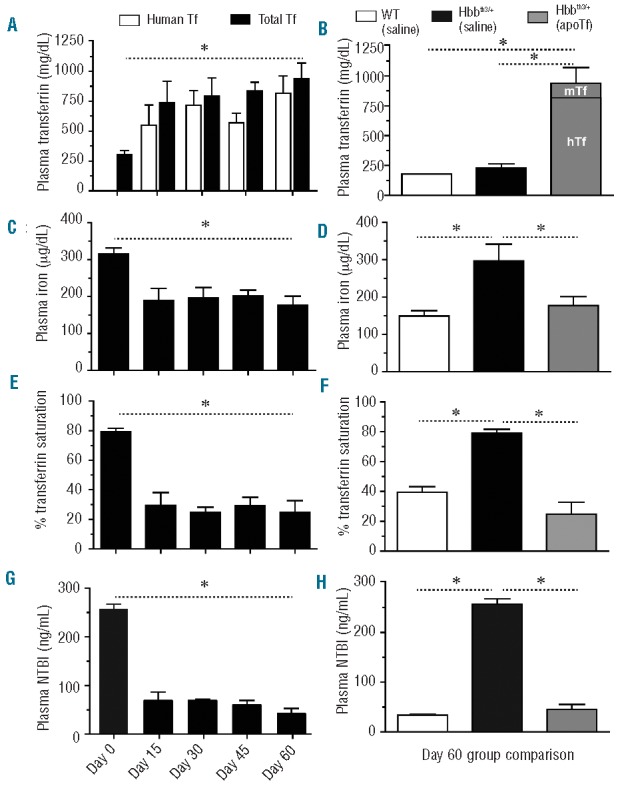
Effects of apoTf on plasma iron in Hbbth3/+ mice. The graphs show: (A) plasma transferrin concentration; (B) group comparisons in plasma transferrin concentration at 60 days; (C) total plasma iron; (D) group comparisons in total plasma iron level at 60 days; (E) percentage transferrin saturation; (F) group comparisons in percentage transferrin saturation at 60 days; (G) NTBI; (H) group comparisons in NTBI at 60 days; The values are means from ten animals per group and error bars represent the standard error of the mean. Statistical significance is set at a P value <0.05 indicated in panels (A), (C), (E) and (G) as a ∗ for baseline comparisons and in panels (B), (D), (F), (H) for between-group comparisons.