
Figure 3.
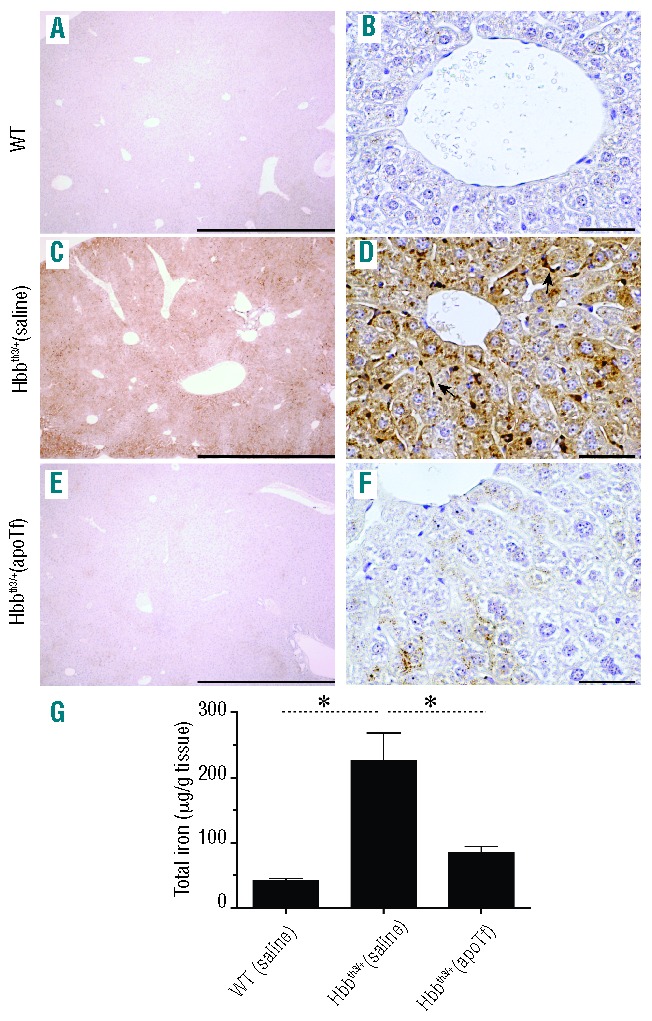
Effects of apoTf on hepatic distribution and content of non-heme iron in Hbbth3/+ mice. Light microscopy images of Perls DAB non-heme iron staining of liver tissue sections under 4× magnification (A) and 40× magnification (B) are shown for WT mice following 60 days of saline administration. The same tissue histopathology is shown for Hbbth3/+ saline dosed mice (C and D) and for Hbbth3/+ apoTf-dosed mice (E–F). Scale bars represent 2 mm (panels (A), (C) and (E), 4× magnification) and 100 μm (panels B, D and F, 40× magnification). (G) Group comparisons for tissue iron at 60 days of treatment. Mean values are based on a total of 10 animals per group and errors bars represent the SEM. Statistical significance is set at a P value <0.05 indicated in panel (K) as a ∗ for between-group comparisons.