
Figure 4.
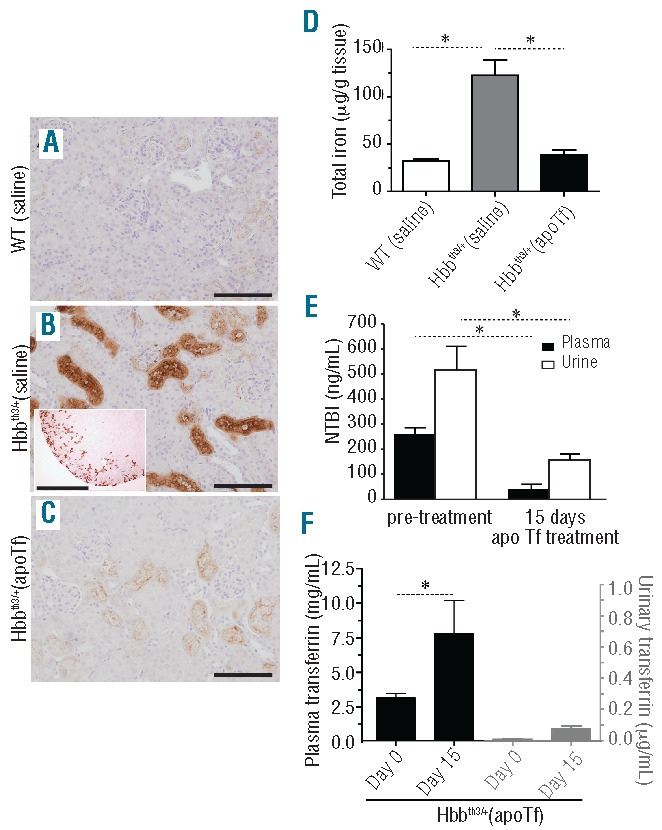
Effects of apoTf on renal iron deposition, urinary NTBI and transferrin excretion in Hbbth3/+ mice. (A–C) Light microscopy images of Perls DAB non-heme iron staining of renal cortex at 20× magnification (scale bar 200 μm). (D) Group comparisons for tissue iron (mg/g kidney weight) at 60 days of treatment. (E) NTBI excreted in the urine of Hbbth3/+ mice at 15 days of apoTf treatment. Plasma Tf and urinary Tf at steady state are compared to illustrate minimal renal excretion of human Tf following dosing sufficient to achieve the maximum constant plasma concentration. Mean values are based on a total of ten animals per group and errors bars represent the SEM. Statistical significance is set at a P value <0.05 indicated in panels (D–F) as a ∗ for between-group comparisons.