
Figure 1.
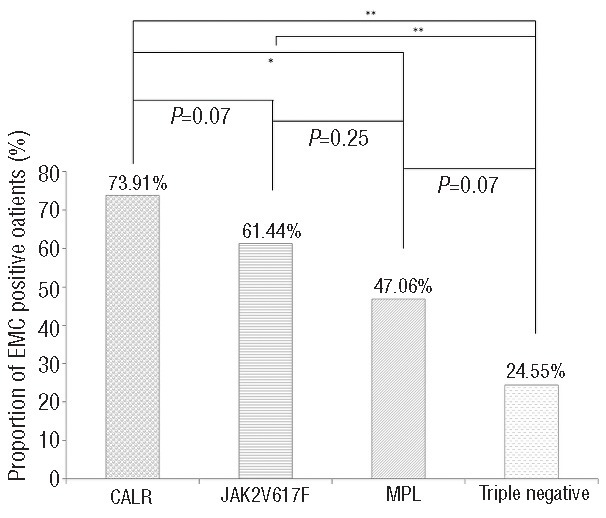
Proportion of patients presenting respectively EMC growth according to mutational status in ET. Statistical differences between mutations were analyzed in pairs (χ2 test). *means P value <0.05; ** means P <0.01.
Official websites use .gov
A
.gov website belongs to an official
government organization in the United States.
Secure .gov websites use HTTPS
A lock (
) or https:// means you've safely
connected to the .gov website. Share sensitive
information only on official, secure websites.
Proportion of patients presenting respectively EMC growth according to mutational status in ET. Statistical differences between mutations were analyzed in pairs (χ2 test). *means P value <0.05; ** means P <0.01.