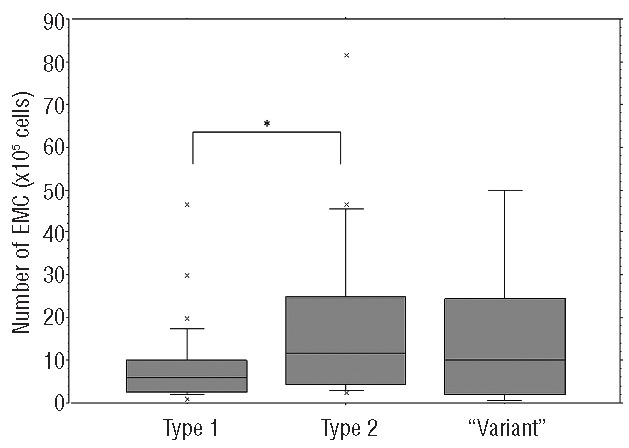
Figure 2.

Distribution of number of endogenous megakaryocytic colonies (EMC) among CALR population showing EMC growth. “Variant” corresponds to neither type 1 nor type 2 mutations. Whisker plots represent numbers of EMC expressed per 105 cells plated according to type of CALR mutation. *means P <0.05.
