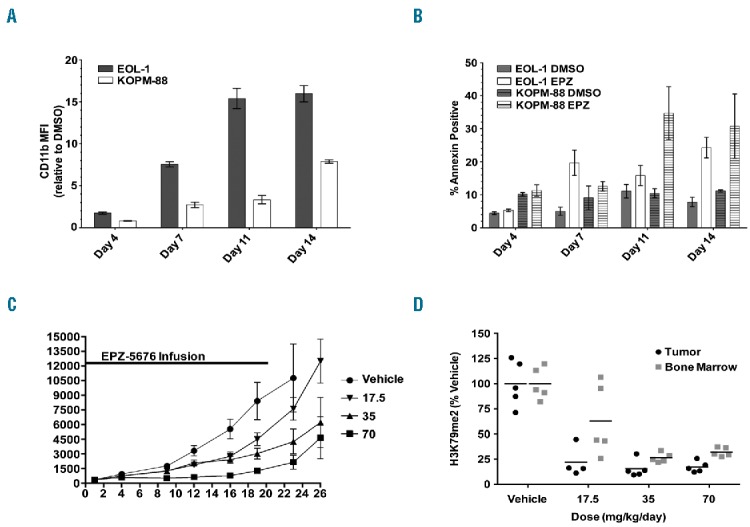
Figure 3.

DOT1L inhibition causes differentiation and apoptosis in MLL-PTD leukemia cell lines and impairs MLL-PTD leukemia cell proliferation in vivo. (A) Mean fluorescent intensity (MFI) measured by flow cytometry for EOL-1 and KOPM-88 cells treated with 10 μM EPZ004777 for up to 14 days stained with CD11b antibody. Average MFI of EPZ004777 treated biological triplicates are plotted as the fold-change relative to DMSO vehicle control (EPZ/DMSO). Error bars: standard deviation. (B) EOL-1 and KOPM-88 cells were treated with 10 μM EPZ004777 (EPZ) or DMSO vehicle control for up to 14 days and analyzed by flow cytometry every 3–4 days for apoptosis by Annexin V binding. Error bars: standard deviation. (C) Effect of EPZ-5676 administration on the growth of EOL-1 xenograft tumors implanted subcutaneously (SC) in immunocompromised rats. Rats (n=10 per group) were dosed continuously by IV infusion with vehicle, with EPZ-5676 at 17.5 mg/kg/day, 35 mg/kg/day, or 70 mg/kg per day for 21 days. Mean tumor sizes are plotted for each group. Error bars represent the standard deviation. Tumor growth inhibition values on day 23 were 80, 60 and 29% for the 70, 35 and 17.5 mg/kg/day dose groups, respectively. EPZ-5676 blood plasma levels (mean±SD) were 1.31±0.68, 0.68±0.47 and 0.42±0.2 μM in the 70, 35 and 17.5 mg/kg/day dose groups, respectively. (D) Abrogation of H3K79me2 in a nude rat EOL-1 SC xenograft following seven days of continous EPZ-5676 infusion as assessed by quantitative ELISA. H3K79me2 levels were normalized to those of total histone H3 in the same sample and are plotted as a percent of the mean H3K79me2 level in tissue from the vehicle-treated group which is set at 100%. Horizontal lines represent the mean percent H3K79me2 values for each group.
