
Fig 3. Cost-effectiveness acceptability curves (subgroups and overall, net-benefit regression approach).
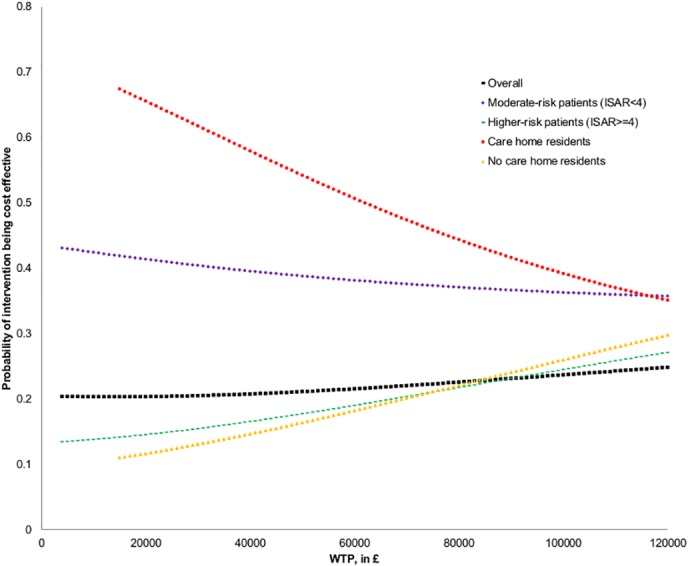
CEACs obtained from p-values, p, for intervention coefficient in net-benefit regressions for WTP≥£4,000 (for which Prob(>F)<0.05). In the case of negative coefficient, probability of cost-effectiveness is equal to p/2, in the case of positive, 1—p/2. Regression models analogical to those presented in Table 5, £1000-intervals for subsequent WTP applied. Due to model specification tests failed for WTP<£15,000, CEACs for care home subgroups are presented starting from WTP = £15,000.