
Fig 3. Mean density (colonies per m2) of Eunicella cavolini populations, tabulated by locality.
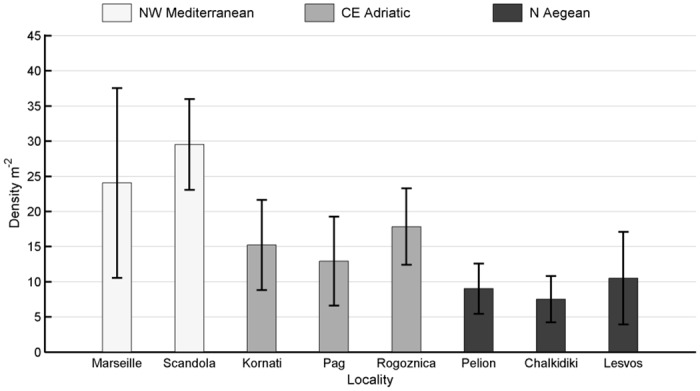
Whisker span indicates standard deviation. Colors denote geographic regions.
Official websites use .gov
A
.gov website belongs to an official
government organization in the United States.
Secure .gov websites use HTTPS
A lock (
) or https:// means you've safely
connected to the .gov website. Share sensitive
information only on official, secure websites.
Whisker span indicates standard deviation. Colors denote geographic regions.