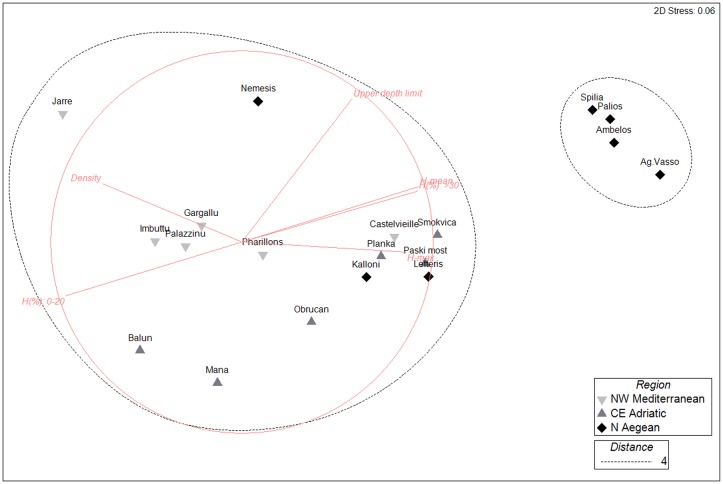
Fig 6. Non-metric multidimensional scaling (MDS) plot of Eunicella cavolini population structure per site.
Different markers indicate different regions. Black dotted lines signify clusters formed at Euclidean distance equal to 4. The superimposed red lines denote the Euclidean distance coefficients used, after data normalization: mean height, max height, H% (proportion of height classes ≤20 cm and >30 cm), height skewness, height kurtosis, density, and upper depth distribution.

