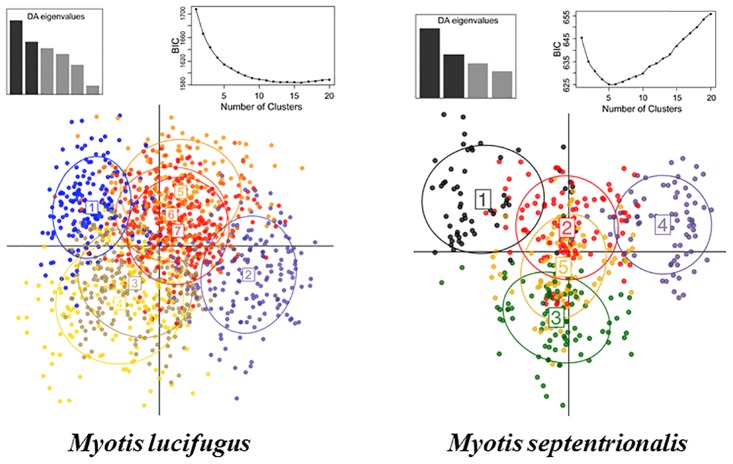
Fig 4. Little brown bat (Myotis lucifugus) and northern long-eared bat (M. septentrionalis) inference of population structure.
Little brown bat and northern long-eared bat scatterplots of genetically distinct clusters identified through DAPC within adegenet. Also shown are the corresponding BIC plots for various numbers of clusters (above right) and the DA eigenvalues for the displayed scatterplots (below right).

