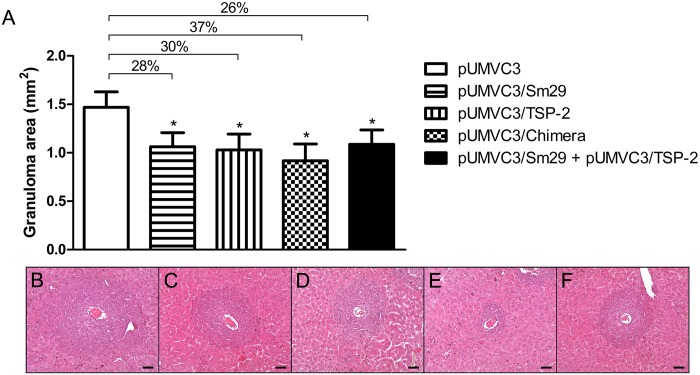
Fig 5. Granuloma area reduction and representative granulomas of mice immunized with the DNA vaccines and challenged with S. mansoni cercariae.
(A) Graph showing the granuloma area in liver of vaccinated mice. Representative granulomas of (B) pUMVC3; (C) pUMVC3/Sm29; (D) pUMVC3/TSP-2; (E) pUMVC3/Chimera; (F) pUMVC3/Sm29 + pUMVC3/TSP-2 are demonstrated. The scale bar corresponds to 50 μm. Significant differences from mice immunized with the pUMVC3 control are denoted by an asterisk (*) for p<0.05, and the percent reductions are shown.

