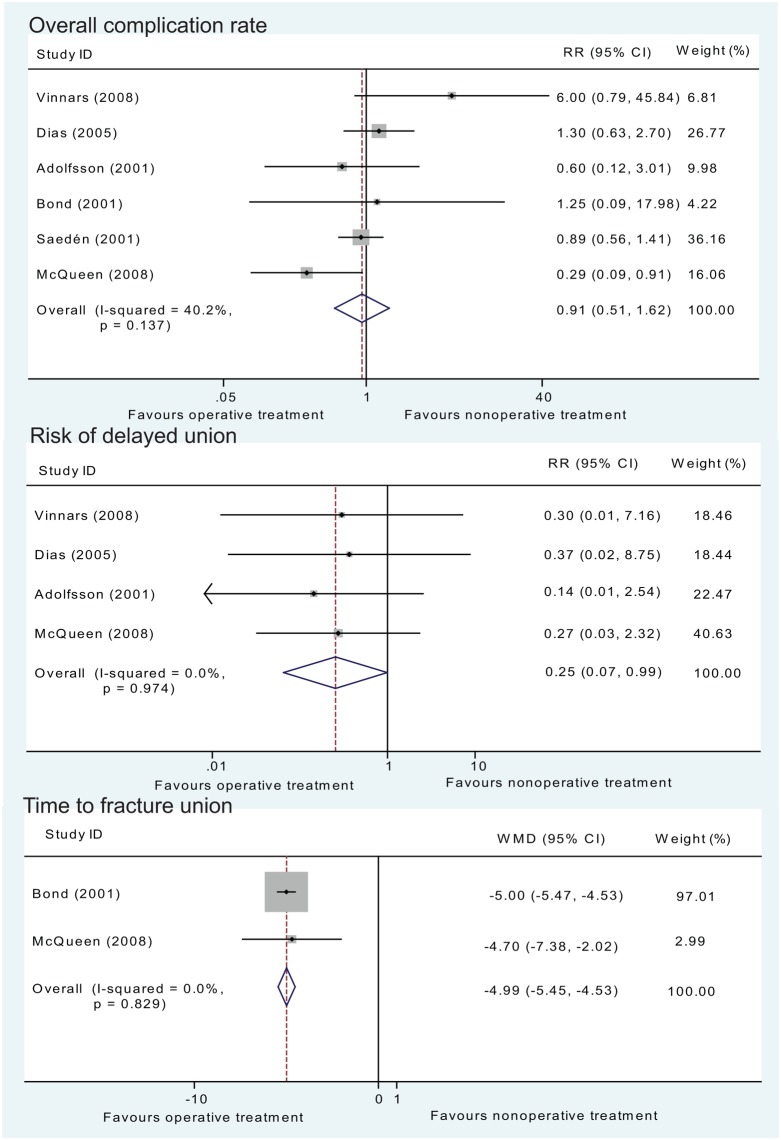
Fig 5. Assessment of the complication rate and time to fracture union of operative versus non-operative treatments.
Upper graph, forest plot for the risk ratio (RR) estimate for overall complication rate. Middle graph, independent analysis regarding the risk of delayed union. Bottom graph, forest plot for the WMD estimate for time to fracture union. ■, weighting given to the trial in the overall pooled estimate, taking into account the number of participants and the amount of inter-study variation (heterogeneity); rhombus, combined effect size.

