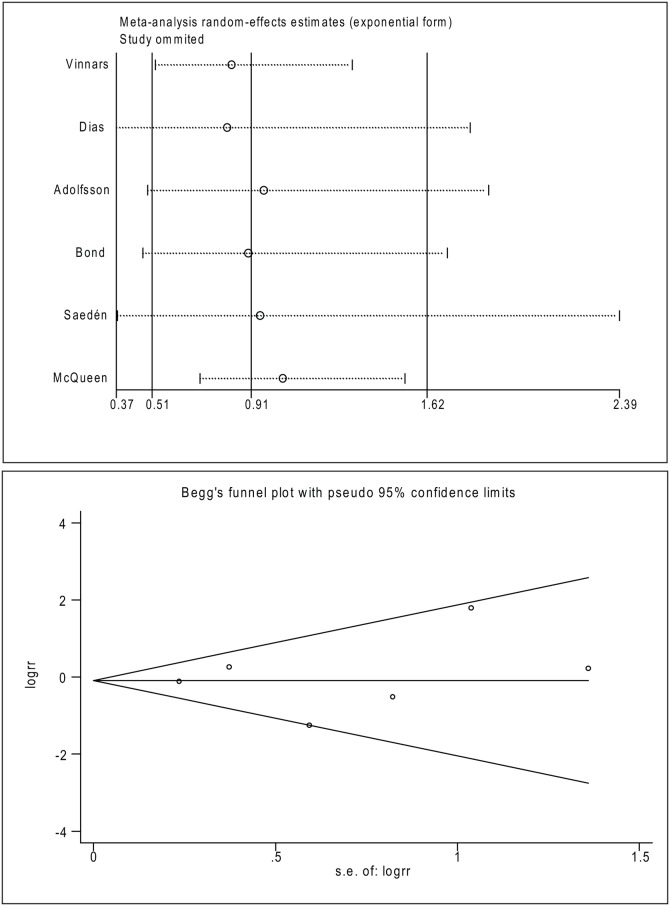
Fig 6. Sensitivity analysis and publication bias analysis of the meta-analysis.
Upper graph: the influence of individual studies on the summary RR were computed by omitting each study in turn. The vertical axis indicates the overall RR and the two vertical axes indicate its 95% CI. Every circle indicates the pooled RR when the left study is omitted in this meta-analysis. The two ends of the dotted lines represent the 95% CI. Bottom graph: Begger’s funnel plot of publication bias in the selection of studies. The vertical axis represents the log [RR] and the horizontal axis indicates the standard error of the log [RR]. The horizontal line and the sloping lines represent the effects summary RR and the expected 95% CI for a given standard error, respectively. Each circle represents an independent study.

