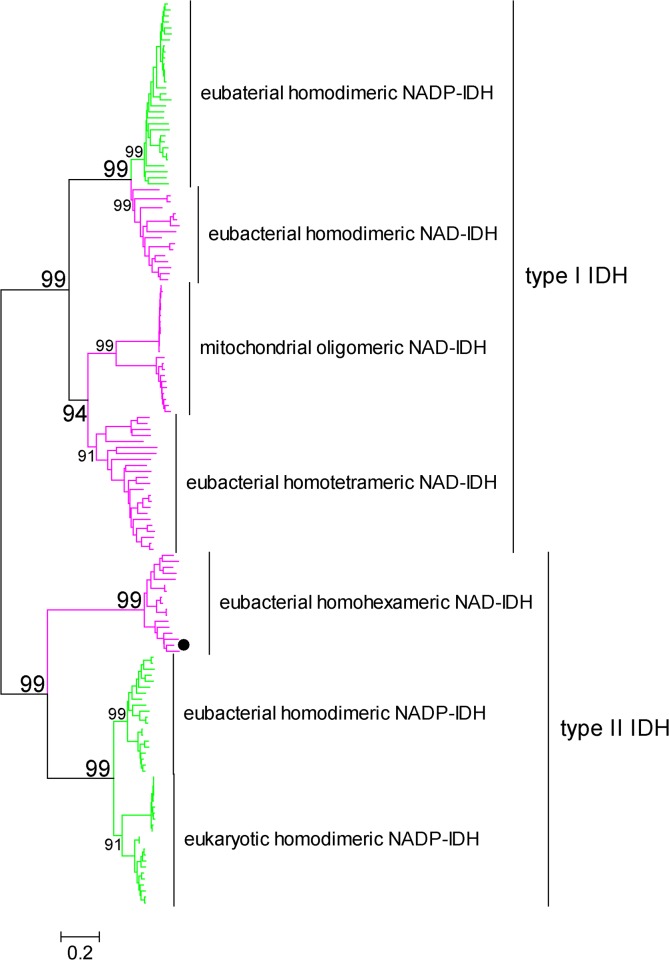
Fig 1. Evolutionary relationships between 151 IDHs from different organisms.
Green branches represent NADP-IDHs, and pink branches represent NAD-IDHs. The evolutionary history was inferred using the neighbor-joining method [35]. The bootstrap consensus tree inferred from 500 replicates represents the evolutionary history of the analyzed taxa [36]. Branches corresponding to partitions that are reproduced in less than 50% of the bootstrap replicates are collapsed. The percentages of replicate trees in which the associated taxa clustered together in the bootstrap test are shown next to the branches [36]. The tree is drawn to scale, with branch lengths presented in the same units as the evolutionary distances that were used to infer-he phylogenetic tree. The evolutionary distances were computed using the Poisson correction method [37] and are shown in units of ‘number of amino acid substitutions per site’. All positions containing gaps and missing data were eliminated from the dataset (complete deletion option). A total of 255 positions were in the final dataset. Phylogenetic analyses were conducted using MEGA4 [15].

