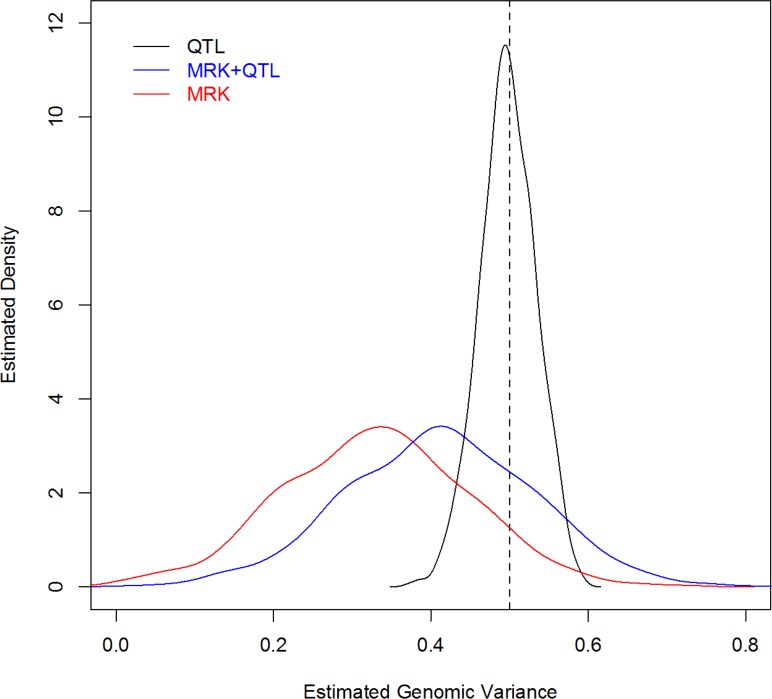
Fig 2. Density plot of estimated genomic heritability (1,000 MC replicates) by analysis scenario (Simulation 2).
The vertical dashed line gives the simulated heritability (QTL, MRK, MRK+QTL indicate whether QTL genotypes, or marker genotypes, MRK, or both, MRK+QTL, were used to compute genomic relationships).

