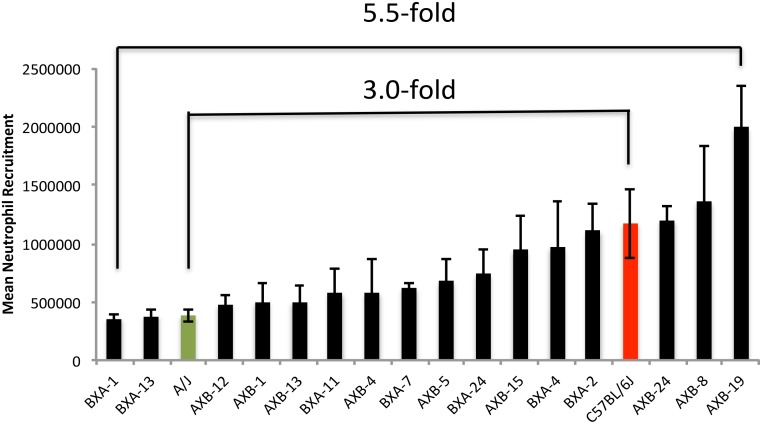
Fig 1. Neutrophil recruitment variation in AXB-BXA RI and the parental mouse strains, A and B (n = 80, up to 6mice/strain).
Hemocytometer cell count is expressed as mean number of neutrophil recruited ± SEM. This strain distribution panel shows a 3.0- fold recruitment variation between the 2 parental strains (p = 0.05) and 5.5-fold between the lowest and highest responders (p<0.001).

