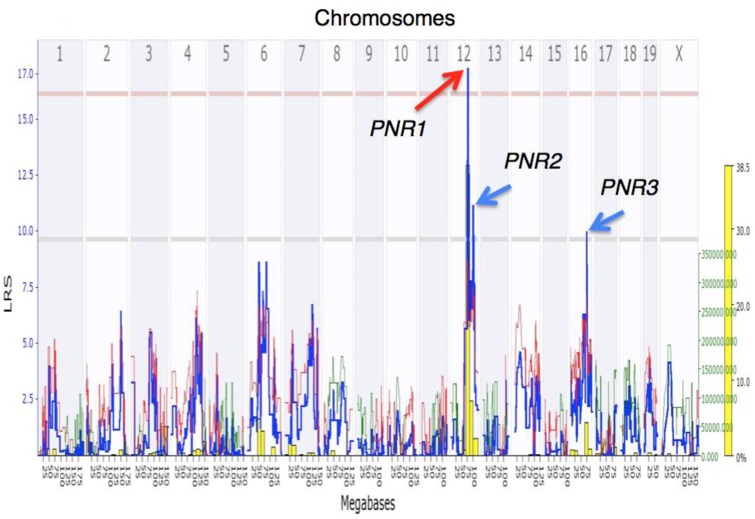
Fig 2. Genome-wide interval mapping of NR in AXB-BXA RI mice and their A and B parents (n = 80, up to 6mice/strain).
The significant Likelihood Ratio Statistic (LRS) values associated with marker loci on Chr 12 peaking at an LRS = 17.5 (LOD = 3.8) delimit a QTL (PNR1) at a confidence length spanning from 72.81 to 78.28 Mb. The analysis mapped two additional suggestive QTLs: PNR2 maps to Chr 12 and is associated with an LRS = 11.0 (LOD = 2.4, p < 0.63), spanning from 87.0–101.6 Mb, and PNR3 maps to Chr 16, associated with an LRS = 9.7 (LOD = 2.1, p < 0.63) and spanning from 56.5–75.0 Mb. The overlaying histogram (yellow columns) shows results of the bootstrapping statistical analysis (in % of the 2000 reiterations, see text). The contribution to the variance conferred by alleles from parent B (red line) or A (green line) at each marker locus along the genome is associated with values measured by the right Y axis (green font).

