
Fig 5. Maximum likelihood estimates of haplotypes present within the passaged virus populations and contribution of minority variants to population fitness.
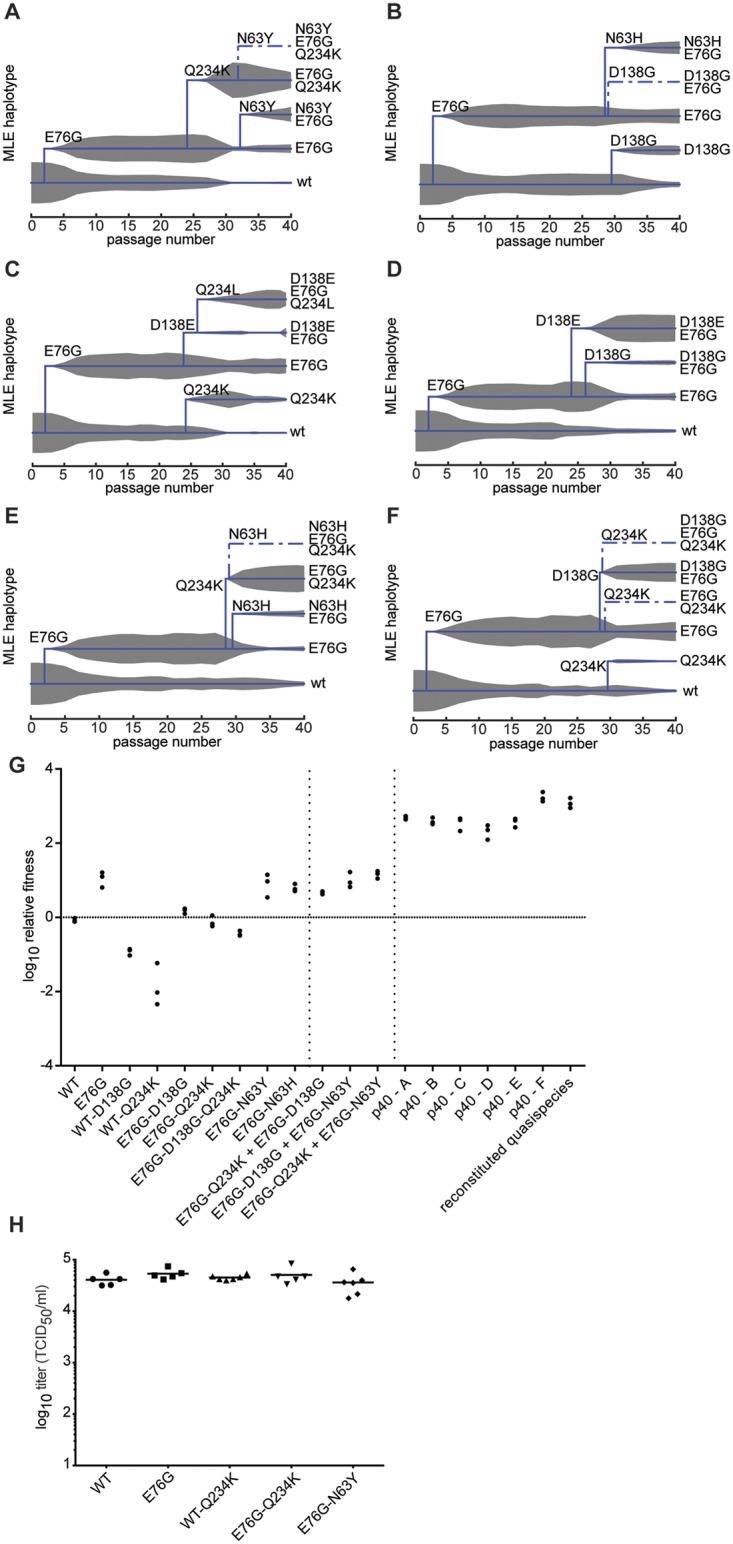
MLE was performed using the frequency values of each mutation at each passage in the deep sequence data for replicates a-f (A-F). The trees indicate the presence of wildtype genotype (lowest line on tree) along with the predicted haplotypes as they emerge during the passage series (x-axis). Solid lines indicate haplotypes with highest MLE scores, dashed lines indicate alternative haplotypes that could exist, with lower scores. The thickness of grey area indicates the expected frequency of each haplotype in the population, according to deep sequence data. (G) Relative fitness of the wildtype (WT), single, double and triple variants, followed by combinations of single variants, followed by passaged population samples (p40 replicates A-F) and reconstituted quasipecies. Reconstituted quasispecies is composed of 50:30:10:10 of E76G, E76G+N63Y, E76G+D138G, and E76G+Q234K. Vertical dashed lines are placed to separate the aforementioned groups to facilitate the reader. Horizontal line is placed to facilitate reading of neutral fitness (value 0). The relative fitness (y-axis) is the ratio of the viral RNA quantification at 24h and 0h, mean values with SEM, n = 3. (H) A549 cells were transfected with in vitro transcribed infectious RNA corresponding to dawildtype (WT), single and double variants. At 8 hours post-transfection, the progeny virus was quantified by TCID50 assay. No significant differences were observed between WT and variants (p = 0.203, 0.400, 0.365, 0.504, respectively, n = 5–6, two-tailed Mann Whitney test).