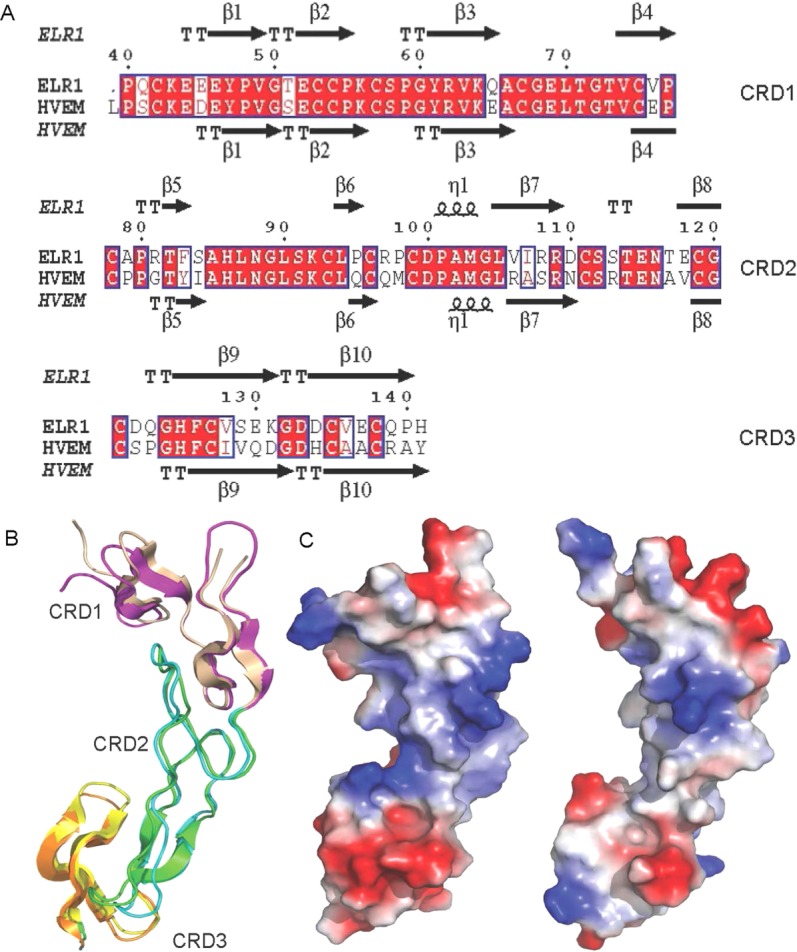
Figure 4.

Structure comparison of ELR1 and HVEM. (A) Structure-based sequence alignment between ELR1 and HVEM (PDB: 4FHQ). Conserved residues are highlighted in red. Secondary structural elements are labeled. Numbering above the sequences corresponds to ELR1 residue numbers. (B) Superposition of the structurally conserved domains of ELR1 and HVEM. HVEM is shown in a cartoon representation with CRDs 1–3 colored yellow, cyan and orange, respectively. (C) The solvent-accessible electrostatic surface of ELR1 (left) and HVEM (right).
