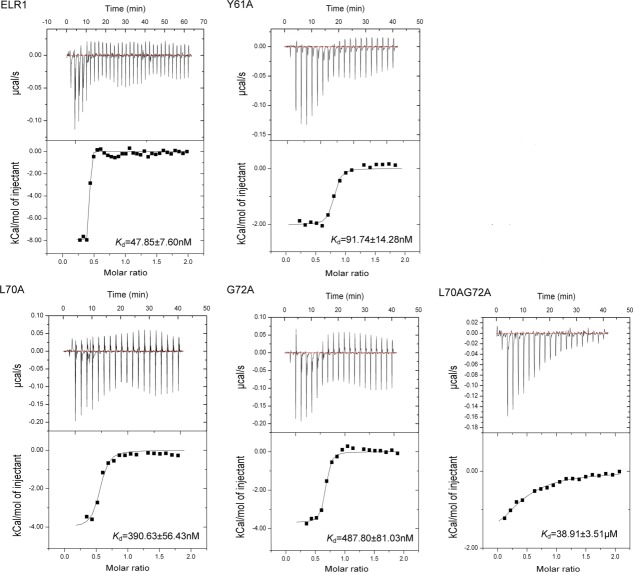
Figure 6.
Isothermal titration calorimetry (ITC) profiles of ELR1 binding to gp90. The observed binding isotherm is normalized as kilocalories per mole of injectant. The top panels show the raw data for heat changes (ΔH) produced by successive injections of gp90 into ELR1. The lower panel shows the integrated binding isotherms as a function of the molar ratio of gp90 to ELR1. The measured ΔH is corrected for heat changes from control experiments. The heat associated with each injection is calculated by integrating the area under the deflection of the measured signal (μcal/s).

