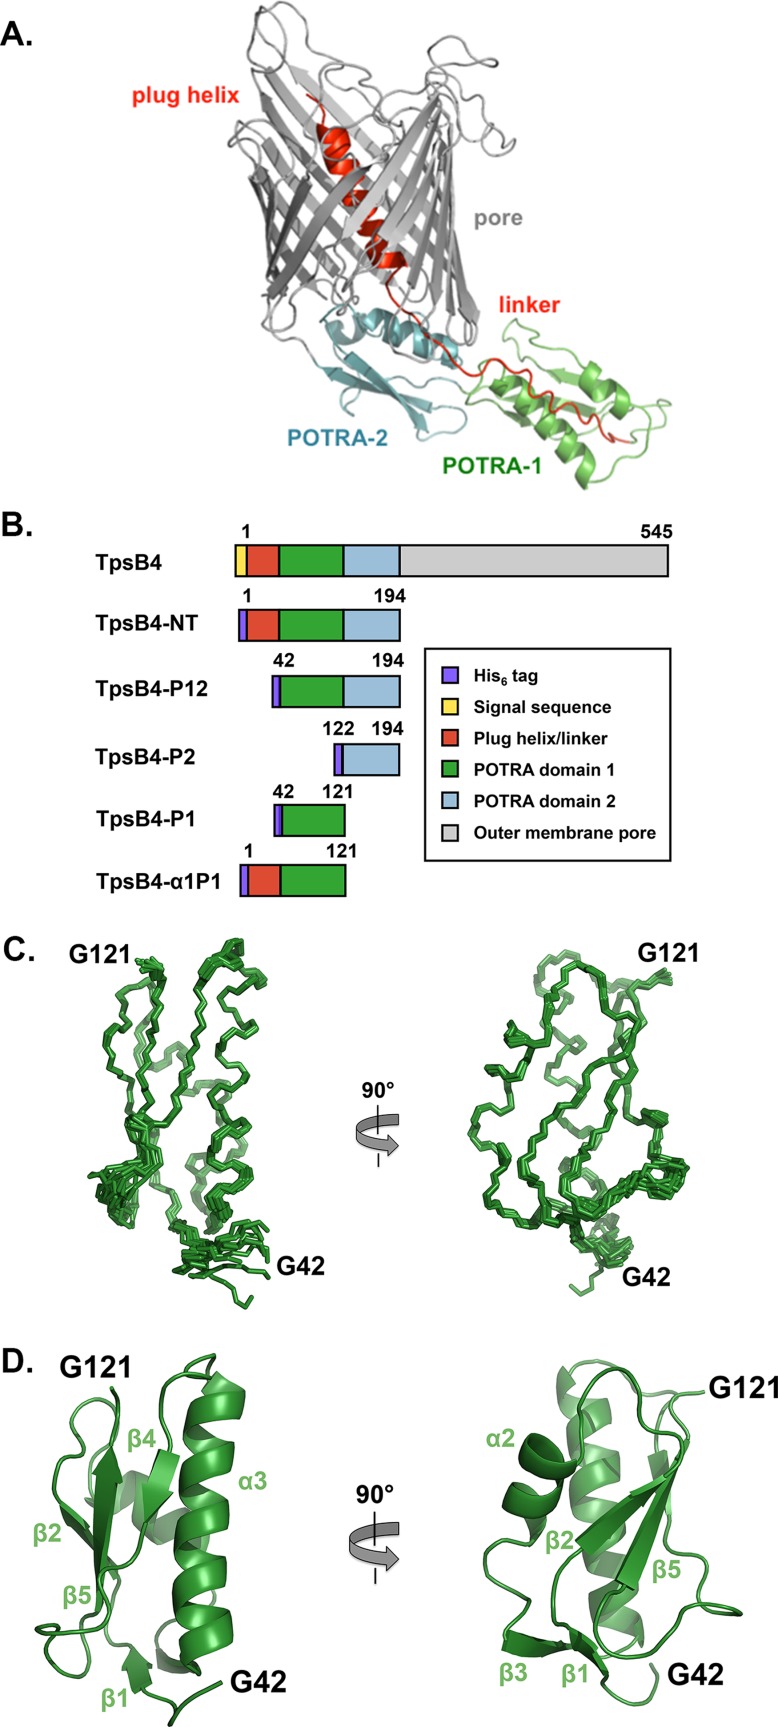
Figure 2.

Domain organization of TpsB4 and solution NMR structure of the TpsB4 POTRA1 domain. (A) Model of full length P. aeruginosa TpsB4 generated using the I-Tasser server.42 (B) Schematic representation of the constructs used in this study and domains are colored as in (A). (C) Backbone superimposition of the ten best NMR structures of TpsB4-P1 shown in two orientations. An interactive view is available in the electronic version of the article (D) Secondary structure of one of the final TpsB4-P1 structures shown as cartoon. Numbering is based on mature TpsB4 minus the N-terminal signal sequence. An interactive view is available in the electronic version of the article
