Figure 4.
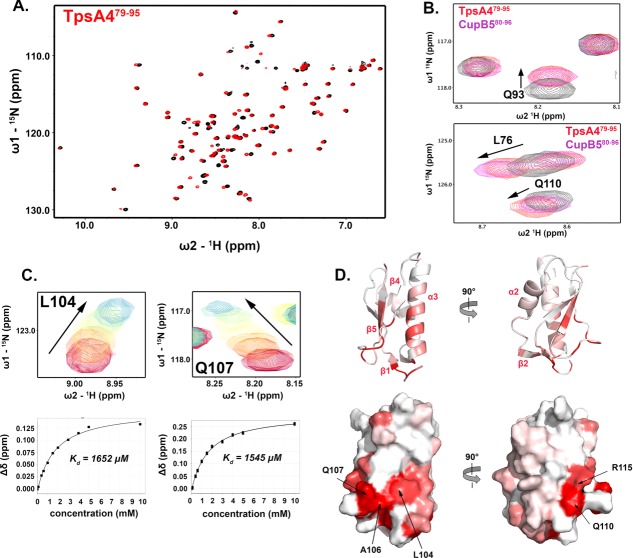
NMR analysis of TpsB4 POTRA1 domain and TpsA4/CupB5 interactions. (A) 1H-15N HSQC spectra of 15N-labelled TpsB4-P1 (black) with 20 molar equivalents of TpsA479–95 (red). (B) Expanded 1H-15N HSQC spectra for 15N-labelled TpsB4-P1 with two molar equivalents of TpsA479–95 (red) or CupB580–96 (purple). (C) Two representative regions of 1H-15N HSQC spectra for 15N-labelled TpsB4-P1 titrated against TpsA479–95. Examples of the corresponding binding curves are displayed below. (D) Composite TpsA479–95 and CupB580–96 interactions mapped onto the surface of TpsB4-P1. Red areas indicate residues in close vicinity to TpsA479–95 and CupB580–96. Numbering is based on mature proteins minus N-terminal signal sequences. An interactive view is available in the electronic version of the article

