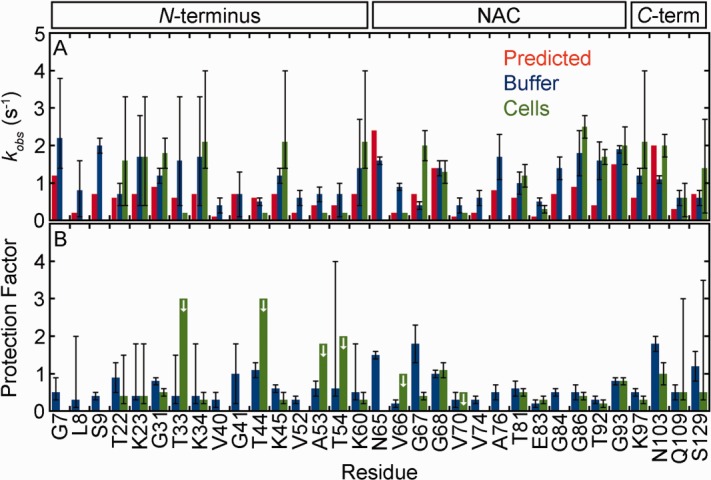
Figure 2.

α-Synuclein exhibits similar backbone amide hydrogen exchange rates in cells and in buffer (pH 6.7, 288 K). (A) Rates from prediction (red),22,24,25 and from SOLEXSY data (blue, buffer; green, cells). Uncertainties in buffer are the standard deviation of 20 Monte Carlo noise simulations.29 Uncertainties for the in-cell data are the standard deviation of the mean from three or more trials (For T81 and G93, the uncertainties are the range of two experiments.). Asymmetric error bars are shown for rates derived from the data in Supporting Information Figure S5, as described in the text. In-cell rates without error bars are for residues that exchange too slowly for reliable fits, or have overlapped decay peaks, and were assigned a rate of ≥ 0.2 s−1, the lower limit of SOLEXSY. (B) Protection factors (kint, predicted/kobs, buffer and kint, predicted/kobs, cells). Uncertainties are from propagation of the uncertainties shown in panel A unless the rate was derived from Supporting Information Figure S5. For those residues, the uncertainty reflects a range, as described in the text. The arrows denote residues for which only a maximum value can be assigned.
