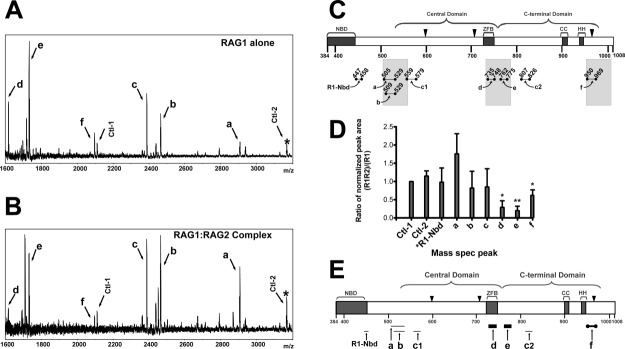
Figure 1.

Resolution of RAG2-interacting regions of core RAG1 by MALDI-TOF mass spectrometry of limited proteolysis products. Spectra of MBP-core RAG1 alone (A) and MBP-core RAG1 with GST-core RAG2 (B) measured following treatment of samples with trypsin. Peaks due to MBP peptides are labeled Ctl-1 or Ctl-2, with Ctl-1 serving as an internal standard. (C) Regions of MBP-core RAG1 assigned to spectra peaks in (A) are illustrated. Brackets indicate the locations of both the central and C-terminal domains. NBD and ZFB refer to the nonamer binding domain and zinc finger B, respectively. CC and HH refer to zinc-binding regions in the C-terminal domain.42 The active site residues (D600, D708, and E962) are depicted with black triangles. Proteolytic peptides of core RAG1 generated by trypsin are represented by bars beneath the core RAG1 schematic, and are labeled a, b, c1, c2, d, e, f and R1-Nbd, as described in the text. The shaded bars denote regions within +/- 25 residues of the central and C-terminal domain boundaries. (D) Quantitative analysis of the limited proteolysis experiments. In each MALDI-TOF mass spectrum, the ratio of the peak area for assigned peaks over the peak area for the Ctl-1 peak was determined, and is referred to as normalized peak areas. Plotted on the Y axis is the ratio of the normalized peak areas for the RAG1 only compared to the RAG1:RAG2 samples that were prepared and analyzed in parallel by mass spectrometry (n = 3 experiments). The labels on the X-axis correspond to the peak labels in panels A and B. *R1-Nbd is a peptide in the NBD of RAG1 (at m/z = 1360), as described in the text. *, P < 0.05; **, P < 0.01 determined by student's t test. (E) Posited sites of core RAG1 that contact with core RAG2. The trypsin-generated core RAG1 peptides (labeled a-f) are represented as bars below their respective positions in the core RAG1 schematic. The thickest black bars represent core RAG1 peptides (d and e) that were substantially decreased in abundance upon trypsin digestion in the presence of RAG2. Peptide f (represented as a thick black bar bordered by solid black circles) was also decreased in the presence of RAG2. The relative abundances of peptides R1-Nbd, a, b, c1, and c2 (shown as light gray bars) were not decreased in presence of RAG2.
