Figure 5.

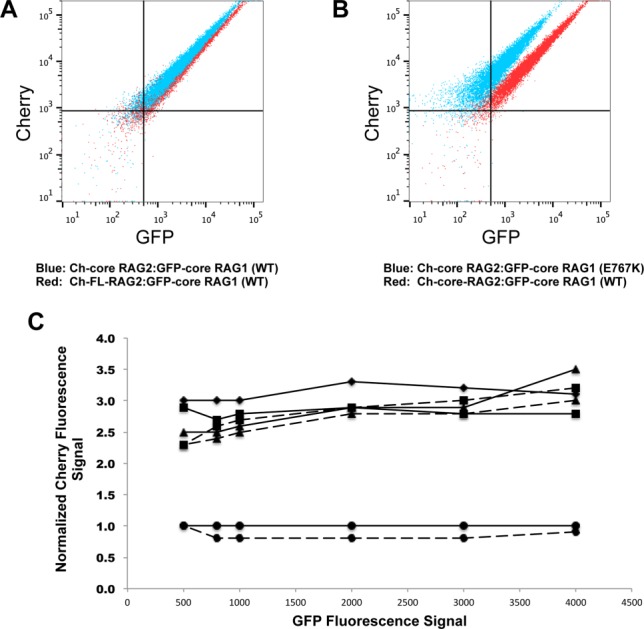
Stoichiometric differences in RAG1 to RAG2 in V(D)J recombinase complexes containing mutant versus WT core RAG1. A: Overlay of the flow cytometry data where RFP-trap beads were incubated with cell lysates coexpressing WT GFP-core RAG1 with either Ch-core-RAG2 (blue dots) or Ch-FL-RAG2 (red dots). B: Overlay of RFP-trap flow cytometry data comparing Ch-core RAG2 co-expressed with either WT (red dots) or E767K (blue dots) GFP-core RAG1. C: Relative stoichiometries of Ch-fused RAG2 to GFP-core RAG1 from representative RFP-trap flow cytometry experiments. Each point is the Cherry fluorescence signal (normalized to the Cherry signal from the coexpressed Ch-FL-RAG2:WT GFP-core RAG1 experiment) at selected GFP fluorescence signals, as illustrated in Figure S7B. Solid and dashed lines are from experiments using Ch-FL RAG2 and Ch-core-RAG2, respectively. Experiments using the different GFP-core RAG1 proteins are represented with the following symbols: WT (circles), C727,730A (diamonds), W760A,R761Q (triangles), and E767K (squares). Results from an RFP-trap experiment using co-expressed Ch-core RAG2 and GFP-core RAG1 (C727,730A) was not shown due to weak complex formation.
