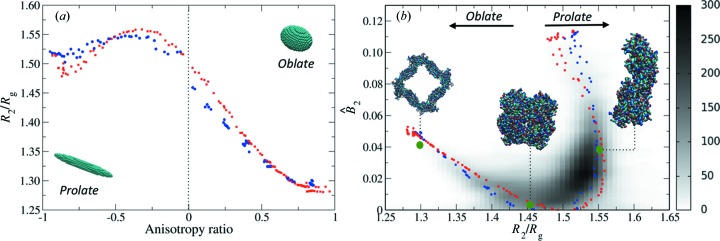
Figure 3.
(a) Example shape descriptors for l = 2. The ratio R
2/R
g is plotted against the anisotropic ratio for ellipsoids (black dots) or cylinders (red squares), allowing the identification of prolate or oblate features. (b) Including the use of  as a shape classifier, normalized against
  , provides further discriminative power between shapes. Small values of
  represent approximately spherical particles, while large values represent either prolate or oblate particles. The density in part (b) represents the empirical distribution of
  pairs, as obtained from known PDB structures (see Appendix A for details).

