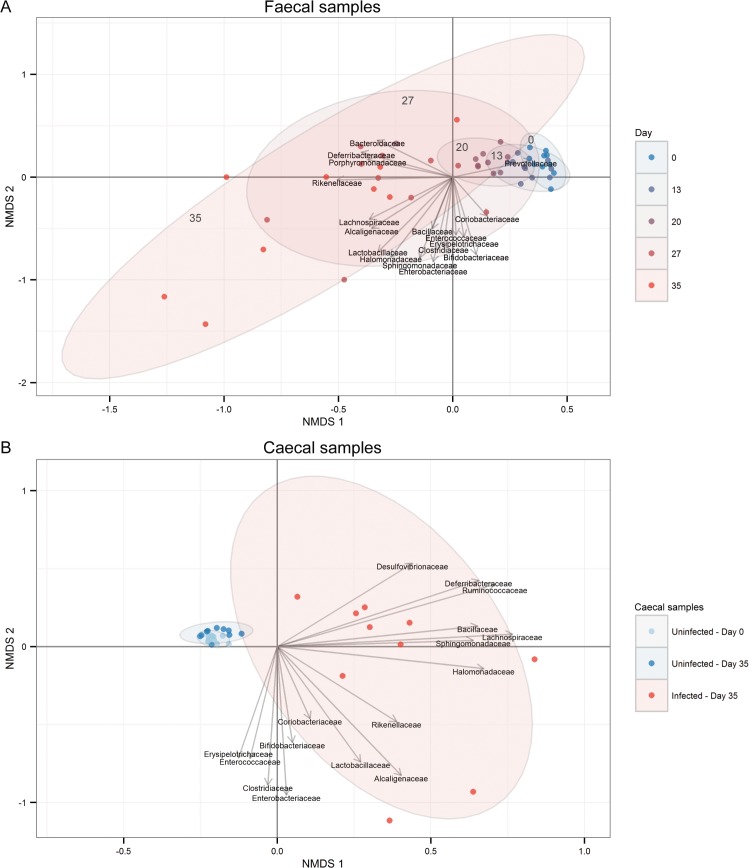
Fig 1. Time-dependent changes of the microbiota diversity due to chronic T. muris infection.
Non-metric Multi-Dimensional Scaling (NMDS) plot using Bray-Curtis dissimilarity indices from (A) faecal microbiota from 10 infected mice sampled at various time points from day 0 to day 35, and (B) caecal microbiota from uninfected mice at day 0 and uninfected/infected mice at day 35. Ellipses are labelled according to the corresponding day of analysis. Relative abundance at family level was fitted as vectors based on 9999 permutations and scaled by their correlation coefficient.

