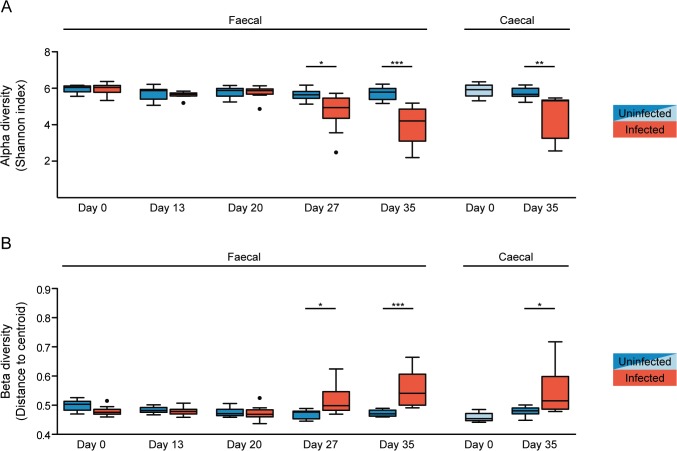
Fig 2. Chronic T. muris infection results in decreased alpha but increased beta diversity of the microbiota.
(A) Median alpha diversity based on Shannon index of unfiltered microbiota data for faecal and caecal samples. The upper and lower whiskers correspond to the 25th and 75th percentiles. (B) Median beta diversity based on Sørensen index for faecal and caecal samples. The whiskers correspond to the 25th and 75th percentiles. Statistical analyses were performed with one-way ANOVA, followed by Tukey’s post-test for multiple comparisons using Prism (GraphPad software). The light blue colour for uninfected caecal samples indicates the ten mice sacrificed at day 0, and therefore not repeated sampling as for the faecal samples. The following definitions were used to denote statistical significance: * (p<0.05), ** (p<0.01), *** (p<0.001), while p>0.05 was considered not significant (NS).

