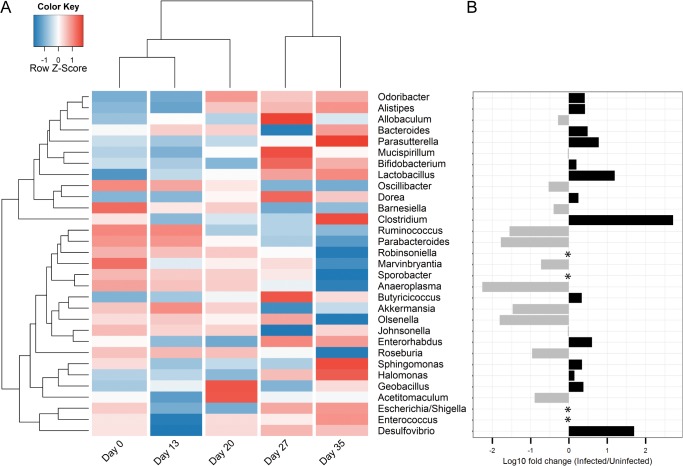
Fig 4. Chronic T. muris infection alters the relative abundance of multiple genera.
(A) Heat-map illustrating changes over time in mean relative abundance at genus level for faecal samples from infected mice. Data are log10 transformed and colour-scaled in the horizontal direction. Blue indicates low values and red indicates high values. Dendrograms are based on hierarchical cluster analysis with Bray-Curtis dissimilarity indices. (B) Log10 fold change between infected and uninfected faecal samples from day 35. (*) Indicates that the genus was undetected in either infected or uninfected samples. Detected only in uninfected: Robinsoniella (0.003%), Sporobacter (0.06%). Detected only in infected: Escherichia/Shigella (0.06%), Enterococcus (0.04%).

