
Figure 3.
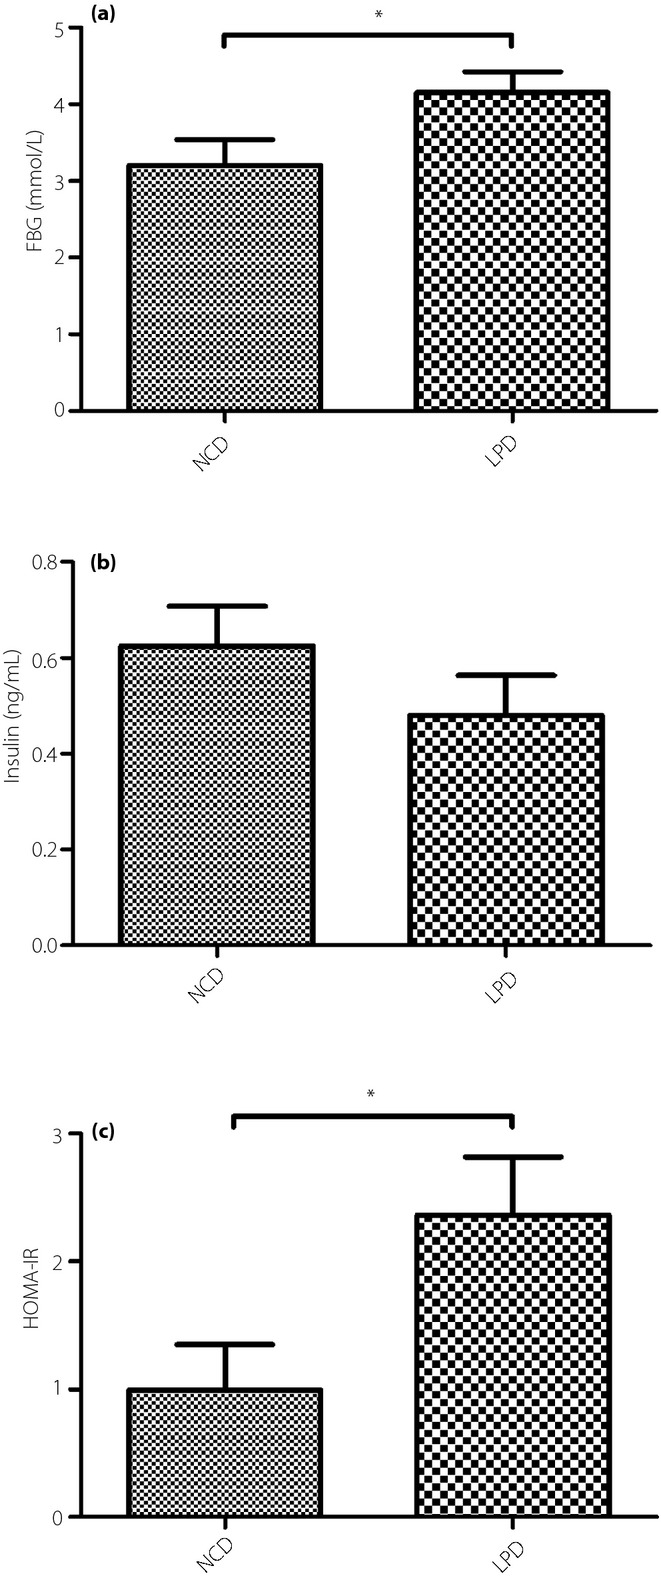
(a) Fasting blood glucose, (b) serum insulin levels (c) and homeostasis model assessment of insulin resistance (HOMA-IR) of the offspring at weaning. All values are the mean ± standard error of the mean (n = 12 mice/group). *P < 0.05 vs normal chow diet (NCD) assessed by Student's t-test. FBG, fasting blood glucose; LPD, low-protein diet.